China Office Supplies Export Enterprises Distribution
| HS Code | Product name | Abbreviation |
| 8305 | Fittings for loose leaf binders or files, letter clips, letter corners, paper clips, indexing tags and similar office articles, of base metal; staples in strips (for example, for offices, upholstery packaging), of base metal | Fittings for loose leaf binders, staples and other office supplies |
| 8440 | Bookbinding machinery, including book sewing machines | Book-binding machinery |
| 8469 | Typewriters other than printers of headingNo.84.43; word processing machines | Typewriters |
| 9023 | Instruments, apparatus and models, designed for demonstrational purposes (for example, in education or exhibitions),unsuitable for other uses | Instruments, apparatus & models, designed for demonstrational purposes |
| 9608 | Ball point pens; felt tipped and other porous tipped pens and markers; fountain pens, stylograph pens and other pens; duplicating stylos; propelling or sliding pencils; penholders, pencil holders and similar holders; parts (including caps and clips) of the | Ballpoint pencil, markers & parts |
| 9609 | Pencils (other than pencils of heading No.96.08), crayons, pencil leads, pastels, drawing charcoals, writing or drawing chalks and tailors, chalks | Pencil and drawing chalk |
| 9610 | Slates and boards, with writing or drawing surfaces, whether or not framed | Slates & boards, with writing or drawing surfaces |
| 9611 | Date, sealing or numbering stamps, and the like (including devices for printing or embossing labels),designed for operating in the hand; hand operated composing sticks and hand printing sets incorporating such composing sticks | Devices for printing or embossing labels hand-operated |
| 9612 | Typewriter or similar ribbons, inked or otherwise prepared for giving impressions, whether or not on spools or in cartridges; inkpads, whether or not inked, with or without boxes | Typewriter & similar ribbons; ink pads |
Product name corresponding to HS Code description
China Office Supplies Exports from Jan. to Dec. 2013 (By export value)
| Product name | Unit | Quantity | Value (USD) | Compared to the same period of last year | |
| Quantity | Value | ||||
| Ballpoint pencil, markers & parts | - | 15,455,186,477 | 1,754,322,738 | 0 | 3.9% |
| Instruments, apparatus & models, designed for demonstrational purposes | kg | 37,648,923 | 728,230,767 | -30.3% | -27% |
| Pencil and drawing chalk | kg | 133,564,249 | 529,381,542 | 6.8% | 12.1% |
| Fittings for loose leaf binders, staples and other office supplies | kg | 159,122,887 | 423,877,437 | -9.6% | -2.1% |
| Slates & boards, with writing or drawing surfaces | kg | 100,187,141 | 345,998,473 | 4.8% | 5.1% |
| Typewriter & similar ribbons; ink pads | set | 192,415,224 | 203,711,340 | -1% | -0.1% |
| Devices for printing or embossing labels hand-operated | kg | 6,089,416 | 52,238,037 | -16.1% | 3.9% |
| Book-binding machinery | - | 349,107 | 31,803,785 | -1.9% | 31.3% |
| Typewriters | set | 1,544,218 | 25,954,489 | -15% | -18.9% |
China Fittings for loose leaf binders, staples and other office supplies (HS: 8305) Export Enterprises Distribution, from Jan. to Dec. 2013 (By export value)
| No. | Region | Accumulative total from Jan.-Dec. | Accumulatively compared to the same period of last year | ||
|
|
| Quantity (kg) | Value (USD) | Quantity | Value |
| 1 | Guangdong | 63,824,092 | 199,745,098 | -17.7% | 1.9% |
| 2 | Zhejiang | 64,530,902 | 143,151,753 | -0.6% | 2% |
| 3 | Shanghai | 10,869,440 | 26,426,091 | 6.7% | 3.7% |
| 4 | Jiangsu | 4,549,758 | 12,924,427 | -6.9% | -23.5% |
| 5 | Tianjin | 8,048,600 | 11,237,965 | -31.9% | -34.6% |
| 6 | Anhui | 2,115,304 | 5,873,625 | 20.2% | 4.1% |
| 7 | Fujian | 712,759 | 4,253,471 | -22.8% | -34.9% |
| 8 | Jiangxi | 728,826 | 3,815,072 | 150.1% | 21.8% |
| 9 | Chongqing | 531,572 | 3,118,618 | -37.4% | -58.5% |
| 10 | Shandong | 1,264,317 | 2,606,858 | 6.3% | 1.6% |
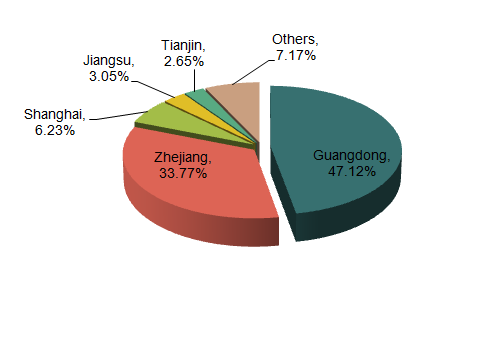
As can be seen from the export data of Jan.-Dec. 2013, China fittings for loose leaf binders, staples and other office supplies original places of exported goods are Guangdong, Zhejiang and Shanghai, among which, the export value of Guangdong and Zhejiang accounted for 47.12% and 33.77% of the total export value of our country.
China Book-binding machinery (HS: 8440) Export Enterprises Distribution, from Jan. to Dec. 2013 (By export value)
| No. | Region | Accumulative total from Jan.-Dec. | Accumulatively compared to the same period of last year | ||
|
|
| Quantity (-) | Value (USD) | Quantity | Value |
| 1 | Zhejiang | 160,351 | 14,596,716 | 12% | 41.1% |
| 2 | Guangdong | 67,314 | 10,484,480 | 21.6% | 57.6% |
| 3 | Shanghai | 46,554 | 3,384,982 | 91% | -3.6% |
| 4 | Jiangsu | 13,653 | 638,262 | -1.3% | 6.2% |
| 5 | Beijing | 6,841 | 530,325 | 0.7% | -34.6% |
| 6 | Shandong | 1,290 | 420,048 | -71.9% | 8.3% |
| 7 | Sichuan | 1,262 | 328,536 | -60.2% | -13.8% |
| 8 | Liaoning | 10,283 | 319,736 | -41.6% | -36.2% |
| 9 | Anhui | 428 | 310,062 | 650.9% | 44.2% |
| 10 | Yunnan | 421 | 201,529 | 1813.6% | 10266.7% |
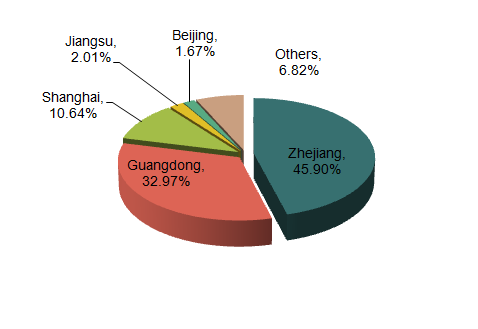
As can be seen from the export data of Jan.-Dec. 2013, China book-binding machinery original places of exported goods are Zhejiang, Guangdong and Shanghai, among which, the export value of Zhejiang and Guangdong accounted for 45.9% and 32.97% of the total export value of our country.
China Typewriters (HS: 8469) Export Enterprises Distribution, from Jan. to Dec. 2013 (By export value)
| No. | Region | Accumulative total from Jan.-Dec. | Accumulatively compared to the same period of last year | ||
|
|
| Quantity (set) | Value (USD) | Quantity | Value |
| 1 | Guangdong | 1,530,499 | 24,412,346 | -10.8% | -5.6% |
| 2 | Shanghai | 7,263 | 600,316 | -70.4% | -63.8% |
| 3 | Zhejiang | 5,174 | 481,298 | 24.1% | 14.4% |
| 4 | Jiangsu | 649 | 227,096 | -99.1% | -94% |
| 5 | Shandong | 117 | 85,255 | 234.3% | -21.4% |
| 6 | Chongqing | 20 | 30,487 | 66.7% | 34.5% |
| 7 | Hebei | 18 | 30,431 | 50% | 129.5% |
| 8 | Liaoning | 8 | 18,567 | -82.6% | 98.7% |
| 9 | Fujian | 185 | 18,070 | -73.3% | -74.6% |
| 10 | Beijing | 14 | 14,513 | -66.7% | -54.5% |
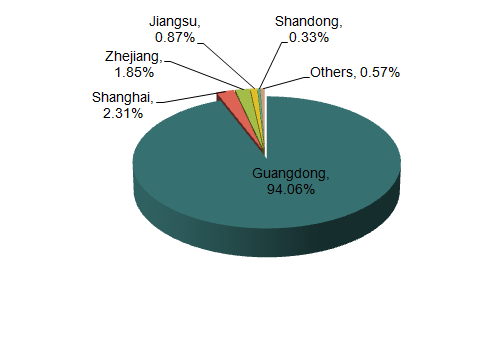
As can be seen from the export data of Jan.-Dec. 2013, China typewriters original places of exported goods are Guangdong, Shanghai and Zhejiang, among which, the export value of Guangdong accounted for 94.06% of the total export value of our country, and the original places of exported goods are highly concentrated.
China Instruments, apparatus & models, designed for demonstrational purposes (HS: 9023) Export Enterprises Distribution, from Jan. to Dec. 2013 (By export value)
| No. | Region | Accumulative total from Jan.-Dec. | Accumulatively compared to the same period of last year | ||
|
|
| Quantity (kg) | Value (USD) | Quantity | Value |
| 1 | Guangdong | 25,403,741 | 505,697,354 | -21.7% | -5.9% |
| 2 | Jiangsu | 2,144,335 | 44,512,128 | -36.3% | -48.2% |
| 3 | Shanghai | 1,371,473 | 21,939,566 | 17.6% | -3% |
| 4 | Zhejiang | 2,119,906 | 19,259,699 | -42.8% | -30.2% |
| 5 | Shandong | 654,751 | 18,447,851 | 14.7% | -15.3% |
| 6 | Beijing | 612,954 | 14,185,155 | 73.1% | 59.3% |
| 7 | Henan | 689,940 | 12,004,727 | -6.1% | 112.8% |
| 8 | Chongqing | 721,197 | 11,674,009 | -84.9% | -91.1% |
| 9 | Jiangxi | 558,727 | 10,180,338 | -59.3% | -68.2% |
| 10 | Liaoning | 499,763 | 10,149,388 | 9.3% | -10.1% |
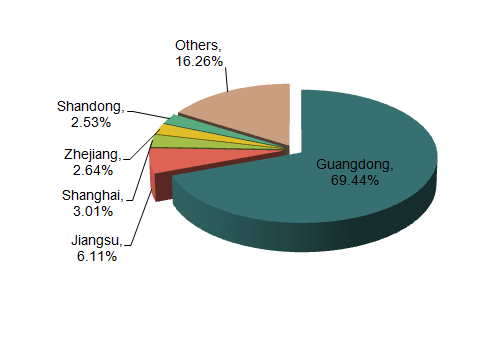
As can be seen from the export data of Jan.-Dec. 2013, China instruments, apparatus & models, designed for demonstrational purposes original places of exported goods are Guangdong, Jiangsu and Shanghai, among which, the export value of Guangdong accounted for 69.44% of the total export value of our country, and the original places of exported goods are highly concentrated.
China Ballpoint pencil, markers & parts (HS: 9608) Export Enterprises Distribution, from Jan. to Dec. 2013 (By export value)
| No. | Region | Accumulative total from Jan.-Dec. | Accumulatively compared to the same period of last year | ||
|
|
| Quantity (-) | Value (USD) | Quantity | Value |
| 1 | Zhejiang | 11,491,283,106 | 996,763,693 | 0.1% | 5.2% |
| 2 | Guangdong | 1,268,317,186 | 328,045,761 | -14.9% | 1.8% |
| 3 | Shanghai | 1,137,815,819 | 157,258,077 | -5.9% | -4.2% |
| 4 | Jiangsu | 489,338,169 | 61,692,327 | 31.6% | 5.1% |
| 5 | Shandong | 343,416,352 | 55,409,106 | 14.2% | 9.1% |
| 6 | Xinjiang Uygur Autonomous Region | 210,486,027 | 38,645,029 | 27% | -18.4% |
| 7 | Chongqing | 9,263,479 | 27,730,363 | -4.9% | 49.5% |
| 8 | Fujian | 230,508,882 | 21,734,047 | 29.5% | -4.4% |
| 9 | Tianjin | 44,957,550 | 16,106,461 | -13% | -5.7% |
| 10 | Guangxi Zhuang Autonomous Region | 30,066,181 | 11,349,369 | 335.6% | 935.2% |
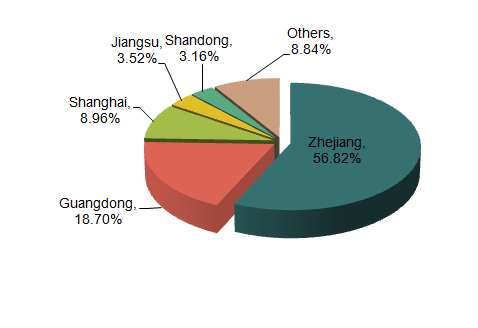
As can be seen from the export data of Jan.-Dec. 2013, China ballpoint pencil, markers & parts original places of exported goods are Zhejiang, Guangdong and Shanghai, among which, the export value of Zhejiang accounted for 56.82% of the total export value of our country, and the original places of exported goods are highly concentrated.
China Pencil and drawing chalk (HS: 9609) Export Enterprises Distribution, from Jan. to Dec. 2013 (By export value)
| No. | Region | Accumulative total from Jan.-Dec. | Accumulatively compared to the same period of last year | ||
|
|
| Quantity (kg) | Value (USD) | Quantity | Value |
| 1 | Zhejiang | 56,200,521 | 179,079,804 | 14.7% | 20.6% |
| 2 | Shanghai | 19,692,836 | 111,146,989 | -0.3% | 3.7% |
| 3 | Shandong | 13,950,610 | 63,758,442 | -2.1% | -4% |
| 4 | Jiangsu | 10,111,879 | 46,553,255 | 21.9% | 23.1% |
| 5 | Guangdong | 12,168,852 | 46,461,160 | 8.6% | 46.4% |
| 6 | Beijing | 2,695,489 | 26,359,523 | 5.8% | 8.8% |
| 7 | Tianjin | 4,669,613 | 12,460,080 | -16.2% | -24.5% |
| 8 | Fujian | 3,870,879 | 9,723,313 | -18.8% | -5.5% |
| 9 | Heilongjiang | 2,133,938 | 9,151,544 | -5.6% | 0.7% |
| 10 | Anhui | 1,894,132 | 7,016,372 | 46.5% | 53.5% |
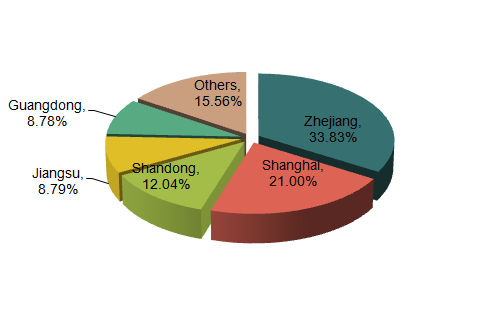
As can be seen from the export data of Jan.-Dec. 2013, China pencil and drawing chalk original places of exported goods are Zhejiang, Shanghai and Shandong, among which, the export value of Zhejiang accounted for 33.83% of the total export value of our country.
China Slates & boards, with writing or drawing surfaces (HS: 9610) Export Enterprises Distribution, from Jan. to Dec. 2013 (By export value)
| No. | Region | Accumulative total from Jan.-Dec. | Accumulatively compared to the same period of last year | ||
|
|
| Quantity (kg) | Value (USD) | Quantity | Value |
| 1 | Zhejiang | 43,964,121 | 138,148,835 | 2.2% | 6.4% |
| 2 | Guangdong | 25,804,374 | 103,477,175 | 3.2% | 5.9% |
| 3 | Fujian | 12,802,755 | 41,798,817 | 24.1% | 21.6% |
| 4 | Shanghai | 4,287,384 | 14,468,023 | -19.7% | -15.7% |
| 5 | Jiangsu | 4,474,440 | 13,233,833 | 0.4% | -8.5% |
| 6 | Shandong | 2,204,522 | 6,707,459 | 16.4% | 16.1% |
| 7 | Henan | 1,766,107 | 4,230,640 | 48.2% | 50.6% |
| 8 | Liaoning | 468,451 | 3,590,207 | 69.6% | 137.6% |
| 9 | Beijing | 1,211,557 | 3,585,245 | -27.7% | -30.7% |
| 10 | Jiangxi | 461,179 | 2,691,712 | 90.4% | 86.1% |
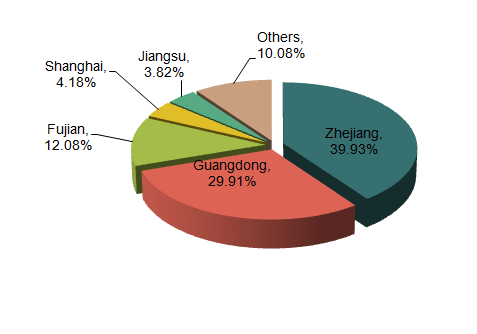
As can be seen from the export data of Jan.-Dec. 2013, China slates & boards, with writing or drawing surfaces original places of exported goods are Zhejiang, Guangdong and Fujian, among which, the export value of Zhejiang and Guangdong accounted for 39.93% and 29.91% of the total export value of our country.
China Devices for printing or embossing labels hand-operated (HS: 9611) Export Enterprises Distribution, from Jan. to Dec. 2013 (By export value)
| No. | Region | Accumulative total from Jan.-Dec. | Accumulatively compared to the same period of last year | ||
|
|
| Quantity (kg) | Value (USD) | Quantity | Value |
| 1 | Guangdong | 2,021,108 | 18,257,533 | -38.3% | 29.2% |
| 2 | Zhejiang | 2,825,398 | 16,997,410 | 2.4% | 0.7% |
| 3 | Shanghai | 480,649 | 6,227,578 | -13.7% | -11% |
| 4 | Jiangsu | 313,166 | 5,278,674 | 37.7% | 8.5% |
| 5 | Fujian | 381,610 | 4,389,529 | 33.4% | -2.7% |
| 6 | Jiangxi | 11,933 | 233,579 | -22.8% | -54.9% |
| 7 | Liaoning | 9,069 | 190,258 | -86.2% | -81.4% |
| 8 | Anhui | 4,655 | 113,240 | -69% | -66.6% |
| 9 | Hubei | 4,779 | 90,205 | 20678.3% | 42854.8% |
| 10 | Guizhou | 5,720 | 82,983 | 0% | 0% |
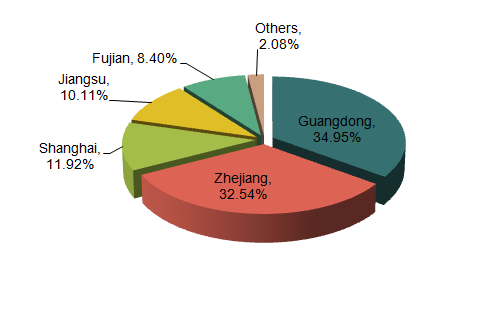
As can be seen from the export data of Jan.-Dec. 2013, China devices for printing or embossing labels hand-operated original places of exported goods are Guangdong, Zhejiang and Shanghai, among which, the export value of Guangdong and Zhejiang accounted for 34.95% and 32.54% of the total export value of our country.
China Typewriter & similar ribbons; ink pads (HS: 9612) Export Enterprises Distribution, from Jan. to Dec. 2013 (By export value)
| No. | Region | Accumulative total from Jan.-Dec. | Accumulatively compared to the same period of last year | ||
|
|
| Quantity (set) | Value (USD) | Quantity | Value |
| 1 | Guangdong | 105,739,966 | 97,061,800 | -6.9% | -0.2% |
| 2 | Zhejiang | 24,449,676 | 29,087,630 | -0.2% | 23% |
| 3 | Shandong | 12,770,044 | 20,451,028 | -16.7% | -17.4% |
| 4 | Shanghai | 5,540,235 | 16,966,672 | -4.3% | 34.1% |
| 5 | Henan | 2,695,061 | 16,943,703 | 41.1% | -17.1% |
| 6 | Jiangsu | 6,800,922 | 7,201,991 | 4.3% | 12.1% |
| 7 | Liaoning | 16,462,447 | 7,187,775 | -6.5% | -22.2% |
| 8 | Tianjin | 14,341,854 | 3,886,070 | 161.7% | -5.1% |
| 9 | Fujian | 2,663,266 | 2,537,261 | -7.5% | -34.8% |
| 10 | Jiangxi | 158,732 | 1,016,555 | -12.7% | 406.9% |
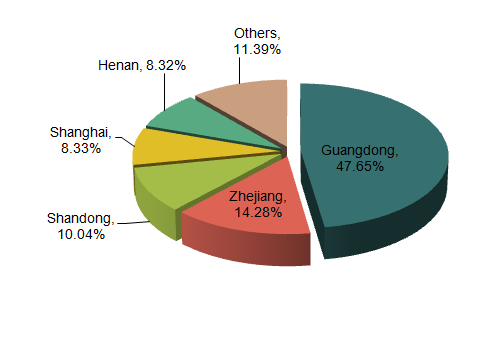
As can be seen from the export data of Jan.-Dec. 2013, China typewriter & similar ribbons; ink pads original places of exported goods are Guangdong, Zhejiang and Shandong, among which, the export value of Guangdong accounted for 47.65% of the total export value of our country.
Source: Customs Information Network


