| No. | Countries/Regions | Jan. to August Total | Year on Year | ||
|
|
| Volume (-) | Value (USD) | Volume | Value |
| 1 | USA | 112,607,814 | 514,509,116 | 6.5% | 1.1% |
| 2 | Australia | 19,527,688 | 129,148,828 | -0.5% | 11% |
| 3 | Japan | 14,906,706 | 114,860,234 | 28% | 4.1% |
| 4 | Germany | 23,697,512 | 86,530,060 | -0.7% | -4.7% |
| 5 | The Russian Federation | 16,229,572 | 67,312,324 | 3.1% | 0.1% |
| 6 | Netherlands | 15,846,853 | 63,721,955 | 29.1% | 9.1% |
| 7 | UK | 16,435,037 | 62,162,250 | 2.9% | -14.7% |
| 8 | Malaysia | 12,780,475 | 49,215,449 | 23.7% | 44.1% |
| 9 | Thailand | 18,082,986 | 46,310,513 | 44.3% | 31.2% |
| 10 | Canada | 7,759,379 | 43,925,611 | 3.6% | -4.6% |

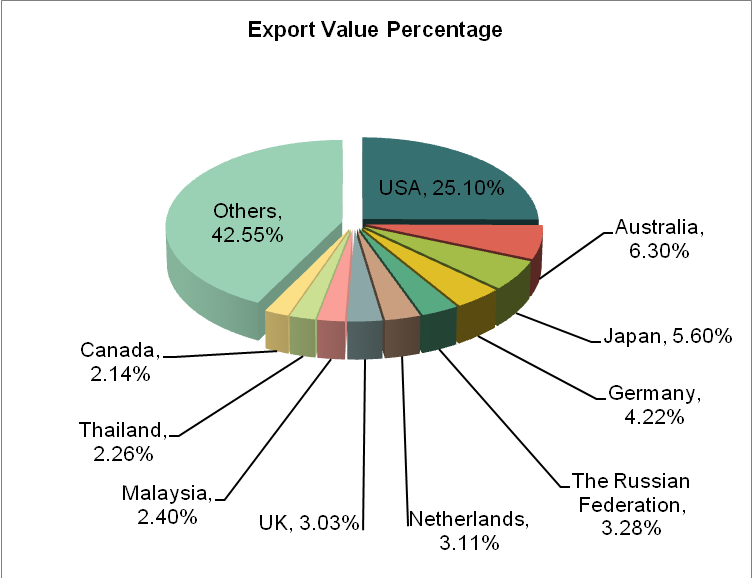
Our country's Trailers and semi-trailers; other vehicles, not mechanically propelled; parts thereof export value amounted to about 2.05 billion US dollars from Jan. to August in 2013, with an increase of 4.7% year on year. Main export countries/regions are the United States, Australia, Japan, Germany, the Russian Federation, the Netherlands, the United Kingdom, Malaysia, Thailand, and Canada and so on. The United States is China Trailers and semi-trailers; other vehicles, not mechanically propelled; parts thereof's key export market. The export value to the United States accounted about 1/4 of the total export value of the product.
Source: Customs Information Network


