| Name | Unit | Quantity | Amount | Compared the Same Period Last Year | |
| Quantity | Amount | ||||
| 847710 injection machine | piece | 17, 874 | 700, 096, 042 | -11.3% | 1.2% |
| 847780 machine for other rubber or plastic | piece | 111, 879 | 623, 713, 525 | 28.1% | 2.2% |
| 847790 the parts listed in 8477 | kg | 84, 638, 328 | 318, 257, 185 | 0% | 6.5% |
| 847720 extruder | piece | 9, 262 | 238, 518, 824 | 20.5% | -6.7% |
| 847730 blow molding machine | piece | 62, 744 | 126, 706, 270 | 534.5% | 13.2% |
| 847759 other mould machine or forming machine | piece | 3, 258 | 104, 554, 112 | 21.4% | 53.9% |
| 847740 vacuum molding machine and other hot forming machine | piece | 10, 079 | 90, 336, 845 | 62.1% | 14.8% |
| 847751 pneumatic tire molding or tube molding machine | piece | 748 | 41, 872, 826 | -25.9% | 15.7% |
| Month | Quantity(-) | Amount(USD) | Compared the Same Period Last Year | |
| Quantity | Amount | |||
| Jan. | 9, 188, 060 | 265, 782, 746 | 14.3% | -2% |
| Feb. | 6, 428, 592 | 197, 160, 708 | 9.5% | 37% |
| Mar. | 9, 432, 126 | 207, 233, 299 | -6% | -12.7% |
| Apr. | 10, 148, 073 | 229, 548, 374 | 7.1% | 0.0% |
| May | 9, 747, 947 | 247, 107, 180 | -7.1% | -5.6% |
| Jun. | 8, 935, 294 | 268, 263, 297 | -11.3% | 8.2% |
| Jul. | 9, 923, 078 | 274, 487, 036 | -8.6% | 4.4% |
| Aug. | 11, 165, 682 | 283, 167, 397 | 9.8% | 14.9% |
| Sep. | 9, 885, 320 | 271, 305, 592 | 1.1% | 8.4% |
| Jan. – Sep. Total | 84, 854, 172 | 2, 244, 055, 629 | 0.1% | 4.3% |
From January to September in 2013, Chinese plastic machinery Export Value is USD 2244000000,increased 4.3% compared the same period last yea
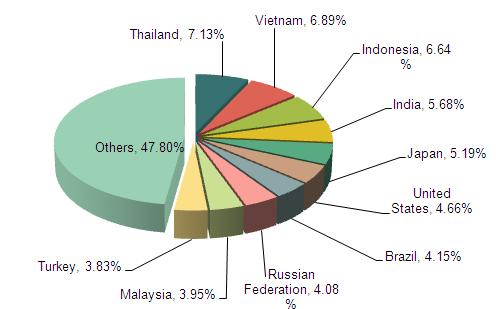
2013 Jan. - Sep. Chinese Plastic Machinery Export Country/ Region
| No. | Country / Region | Quantity(-) | Amount(USD) | Compared the Same Period Last Year | |
| Quantity | Amount | ||||
| 1 | Thailand | 1, 529, 839 | 160, 098, 122 | 26.4% | -6% |
| 2 | Vietnam | 2, 557, 725 | 154, 655, 501 | 25.4% | 63% |
| 3 | Indonesia | 1, 432, 017 | 149, 062, 330 | 41.5% | -0.9% |
| 4 | India | 6, 452, 320 | 127, 372, 396 | 34.6% | -9% |
| 5 | Japan | 18, 821, 599 | 116, 469, 843 | 1.4% | 5.6% |
| 6 | United States | 5, 536, 249 | 104, 532, 761 | -8.6% | 4.5% |
| 7 | Brazil | 1, 012, 742 | 93, 172, 672 | -39.8% | -16.2% |
| 8 | Russian Federation | 377, 262 | 91, 497, 515 | -9.3% | 5.2% |
| 9 | Malaysia | 1, 108, 126 | 88, 558, 779 | 45.2% | 64.6% |
| 10 | Turkey | 320, 653 | 85, 995, 156 | 19.5% | -10% |
| No. | Region | Export Amount(USD) | Proportion |
| 1 | Zhejiang | 686, 174, 194 | 30.58% |
| 2 | Jiangsu | 421, 371, 702 | 18.78% |
| 3 | Guangdong | 395, 000, 057 | 17.60% |
| 4 | Shanghai | 266, 662, 516 | 11.88% |
| 5 | Shandong | 156, 873, 787 | 6.99% |


