Product Directions
| HS Code | Product Names | |
| 65 | 6501 | Hat forms, hat bodies and hoods of felt, neither blocked to shape nor with made brims; plateaux and manchons (including slit manchons) |
| 6502 | Hat-shapes, plaited or made by assembling strips of any material, neither blocked to shape, nor with made brims, nor lined, nor trimmed | |
| 6503 | Felt hats and other felt headgear, made from the hat bodies, hoods or plateaux of heading No. 65.01, whether or not lined or trimmed | |
| 6504 | Hats and other headgear, plaited or made by assembling strips of any material, whether or not lined or trimed | |
| 6505 | Hats and other headgear, knitted or crocheted, or made up from lace, felt or other textile fabric, in the piece(but not in strips), whether or not lined or trimmed; hair-nets of any material, whether or not lined or trimmed | |
| 6506 | Other headgear, whether or not lined or trimmed | |
| 6507 | Head-bands, lining, covers, hat foundations, hat frames, peaks and chinstraps, for headgear | |
The Export Value of China Headgear and Parts Thereof between Jan. -Jun. 2013
| Month | Volume(-) | Value(hundred million dollars) | Compared with the same period of last year | |
| Volume | Value | |||
| Jan | 808,370,418 | 3.82 | 15.0% | 18.9% |
| Feb | 646,852,013 | 2.70 | 92.1% | 72.9% |
| Mar | 520,529,059 | 2.97 | -17.6% | 2.2% |
| Apr | 840,938,760 | 3.59 | 12.7% | 23.8% |
| May | 979,186,916 | 3.96 | 21.4% | 26.0% |
| Jun | 881,350,916 | 4.08 | 18.9% | 23.6% |
| Total | 4,677,228,082 | 21.12 | 18.0% | 24.0% |
In first half of 2013, the export value of headgear and parts thereof reached 2.112 billion dollars, which took a 24% growth than before.
The Import Country/Region Distribution of Chinese Headgear and Parts Thereof between Jan. -Jun. 2013
| No. | Country/Region | Volume(-) | Value(hundred million dollars) | Compared with the same period of last year | |
| Volume | Value | ||||
| 1 | USA | 1,341,945,753 | 4.46 | 19.3% | -6.9% |
| 2 | Russia | 106,599,432 | 3.04 | 33.5% | 155.3% |
| 3 | Jan | 159,092,856 | 1.50 | 2.2% | 1.4% |
| 4 | Germany | 212,096,594 | 0.97 | 6.0% | 17.8% |
| 5 | HK | 165,693,323 | 0.69 | 30.1% | 49.9% |
| 6 | UK | 289,137,784 | 0.68 | 13.4% | 1.0% |
| 7 | Canada | 117,417,232 | 0.54 | 25.0% | 19.0% |
| 8 | France | 141,908,144 | 0.49 | 0.7% | 3.3% |
| 9 | Malaysia | 78,657,282 | 0.44 | 143.2% | 249.3% |
| 10 | Italy | 84,449,440 | 0.43 | 8.1% | -5.1% |
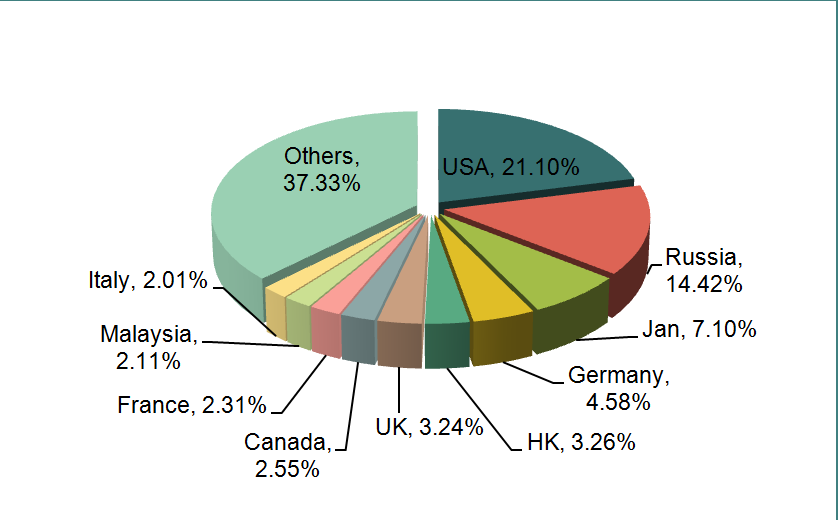
The mainly import countries of Chinese Headgear and parts thereof are USA, Russia and Japan. Among them, the export value to USA reached 21.1% of whole exports, Russia hold 14.42% and Japan took 7.1%. It is pay attention that the export value to Russia and Malaysia took a bigger increasing at top ten consumption markets, which are 155.3% growth for Russia and 249.3% growth for Malaysia.
The Original Goods Delivered Place and Average Export Unit Cost of Chinese Headgear and Parts Thereof between Jan. -Jun. 2013
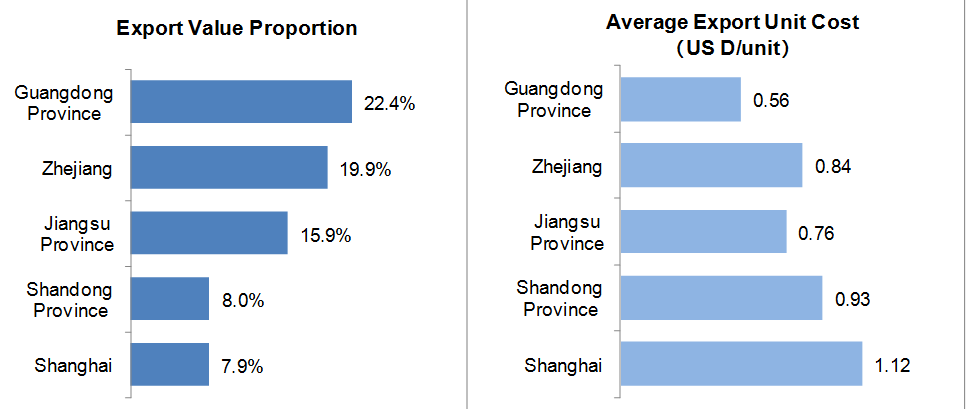
The original Chinese headgear and parts thereof delivered place mainly focuses on Guangdong, Zhejiang and Jiangsu. Among them, Guangdong took 22.4% of whole export value, Zhejiang is 19.9% and Jiangsu is 15.9% between Jan - Jun 2013
Data Source:China Custom


