2011-2013 Global Import Sales Trend for Medicine Industry
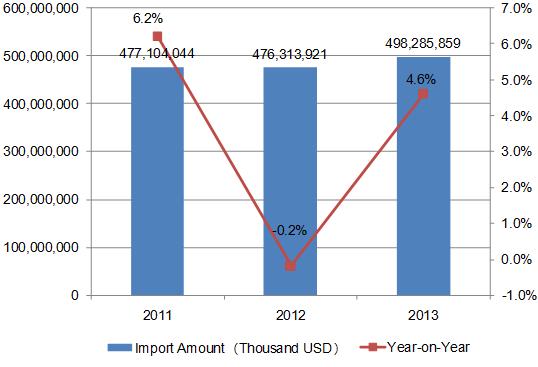
The import sales of Medicine from 2011-2013 increased year by year. The import turnover is 477.10 billion USD, 476.31billion USD and 498.29 billion USD, increased 6.2%, -0.2% and 4.6% year-on- year.
2011-2013 Global Import Trend Analysis for Medicine Industry
| No. | County/Region | Import Turnover (Thousand USD ) | Growth in 2013 Compared with 2011 | ||
| 2011 | 2012 | 2013 | |||
|
| Total | 477,104,044 | 476,313,921 | 498,285,859 | 4.4% |
| 1 | United States | 66,026,931 | 64,390,139 | 63,406,911 | -4.0% |
| 2 | Germany | 48,618,733 | 43,105,824 | 45,153,482 | -7.1% |
| 3 | Belgium | 33,981,685 | 34,782,990 | 40,962,743 | 20.5% |
| 4 | United Kingdom | 26,031,638 | 26,877,231 | 27,728,498 | 6.5% |
| 5 | France | 26,486,034 | 26,379,612 | 26,056,180 | -1.6% |
| 6 | Switzerland | 20,736,595 | 20,392,674 | 22,111,071 | 6.6% |
| 7 | Italy | 21,718,396 | 20,578,104 | 21,048,198 | -3.1% |
| 8 | Japan | 19,973,677 | 23,028,715 | 20,864,258 | 4.5% |
| 9 | Netherlands | 13,259,373 | 13,776,302 | 16,935,884 | 27.7% |
| 10 | China | 10,347,763 | 12,993,175 | 15,096,015 | 45.9% |
| 11 | Russian Federation | 13,185,259 | 13,393,868 | 14,552,450 | 10.4% |
| 12 | Spain | 15,035,763 | 14,342,225 | 14,495,203 | -3.6% |
| 13 | Canada | 12,483,158 | 12,278,687 | 12,123,610 | -2.9% |
| 14 | Australia | 10,440,290 | 10,276,459 | 9,371,015 | -10.2% |
| 15 | Brazil | 6,499,228 | 6,840,853 | 7,420,068 | 14.2% |
| 16 | Poland | 6,047,395 | 5,175,291 | 5,646,350 | -6.6% |
| 17 | Austria | 5,659,407 | 5,191,311 | 5,526,431 | -2.3% |
| 18 | Saudi Arabia | 3,753,668 | 4,394,253 | 5,122,546 | 36.5% |
| 19 | Mexico | 4,540,085 | 4,984,939 | 5,038,340 | 11.0% |
| 20 | Ireland | 5,039,666 | 4,739,747 | 4,896,018 | -2.9% |
The United States is the largest medicine import country from 2011 to 2013, import sales of 2013 is 63.41 billion USD; decreased 4% compared to the same period of 2011, Germany and Belgium ranks second and third. China is ranked tenth, accounted for 3% of the market share.
2011-2013 Global Import Market Share Trend Analysis of Medicine Industry of Region
| No. | County/Region | Import Value Percentage | ||
| 2011 | 2012 | 2013 | ||
| 1 | United States↓ | 13.8% | 12.9% | 12.7% |
| 2 | Germany | 10.2% | 8.7% | 9.1% |
| 3 | Belgium | 7.1% | 7.0% | 8.2% |
| 4 | United Kingdom | 5.5% | 5.4% | 5.6% |
| 5 | France↓ | 5.6% | 5.3% | 5.2% |
| 6 | Switzerland | 4.3% | 4.1% | 4.4% |
| 7 | Italy | 4.6% | 4.1% | 4.2% |
| 8 | Japan | 4.2% | 4.6% | 4.2% |
| 9 | Netherlands | 2.8% | 2.8% | 3.4% |
| 10 | China↑ | 2.2% | 2.6% | 3.0% |
| 11 | Russian Federation | 2.8% | 2.7% | 2.9% |
| 12 | Spain | 3.2% | 2.9% | 2.9% |
| 13 | Canada↓ | 2.6% | 2.5% | 2.4% |
| 14 | Australia↓ | 2.2% | 2.1% | 1.9% |
| 15 | Brazil | 1.4% | 1.4% | 1.5% |
| 16 | Poland | 1.3% | 1.0% | 1.1% |
| 17 | Austria | 1.2% | 1.0% | 1.1% |
| 18 | Saudi Arabia | 0.8% | 0.9% | 1.0% |
| 19 | Mexico | 1.0% | 1.0% | 1.0% |
| 20 | Ireland | 1.1% | 1.0% | 1.0% |
Note: “↑”represents that the data listed continued to increase from 2011 to 2014, “↓”represents that the data listed continued to decrease from 2011 to 2014.
Among top 20 import countries from 2011 to 2013, the market share of China and Saudi Arabia continued to rise, but the market share of the United States, France, Canada and Australia continued to decrease.
2011-2013 Global Export Trend Analysis of Medicine Industry
| No. | County/Region | Export Sales (Thousand USD) | Growth in 2013 Compared with 2011
| ||
| 2011 | 2012 | 2013 | |||
|
| Total | 458,974,850 | 458,311,217 | 485,523,808 | 5.8% |
| 1 | Germany | 68,732,157 | 67,844,612 | 74,930,427 | 9.0% |
| 2 | Switzerland | 53,067,558 | 54,356,386 | 57,550,386 | 8.4% |
| 3 | Belgium | 47,442,345 | 44,841,671 | 50,357,320 | 6.1% |
| 4 | United States | 38,776,005 | 40,061,845 | 39,742,717 | 2.5% |
| 5 | France | 32,911,112 | 34,745,938 | 37,004,862 | 12.4% |
| 6 | United Kingdom | 33,157,245 | 33,101,563 | 32,094,368 | -3.2% |
| 7 | Ireland | 35,336,890 | 29,422,209 | 26,125,645 | -26.1% |
| 8 | Italy | 18,913,843 | 19,988,441 | 23,569,464 | 24.6% |
| 9 | Netherlands | 15,768,714 | 17,226,750 | 22,522,179 | 42.8% |
| 10 | Spain | 11,523,309 | 11,999,787 | 13,030,031 | 13.1% |
| 11 | India | 8,259,853 | 9,602,441 | 11,731,941 | 42.0% |
| 12 | Denmark | 9,878,666 | 10,716,489 | 11,730,502 | 18.7% |
| 13 | Austria | 8,852,242 | 8,442,410 | 8,869,926 | 0.2% |
| 14 | Sweden | 8,079,588 | 7,372,204 | 7,394,170 | -8.5% |
| 15 | Singapore | 6,136,124 | 6,809,817 | 6,797,623 | 10.8% |
| 16 | China | 5,421,338 | 5,890,833 | 6,207,562 | 14.5% |
| 17 | Israel | 7,038,287 | 6,540,527 | 6,063,338 | -13.9% |
| 18 | Canada | 5,544,779 | 5,078,718 | 5,460,364 | -1.5% |
| 19 | Hungary | 4,683,469 | 4,729,380 | 4,921,825 | 5.1% |
| 20 | Australia | 3,794,149 | 4,385,134 | 3,353,987 | -11.6% |
Germany is the largest export country from 2011 to 2013, the import sales of Germany in 2013 is 74.93 billion USD, accounted for 15.4% of total export sales. Switzerland and Belgium ranks second and third.
2011-2013 Global Import Trend Analysis of Medicine Industry of Countries
| No. | County/Region | Export Value Percentage | ||
| 2011 | 2012 | 2013 | ||
| 1 | Germany | 15.0% | 14.8% | 15.4% |
| 2 | Switzerland | 11.6% | 11.9% | 11.9% |
| 3 | Belgium | 10.3% | 9.8% | 10.4% |
| 4 | United States | 8.4% | 8.7% | 8.2% |
| 5 | France | 7.2% | 7.6% | 7.6% |
| 6 | United Kingdom | 7.2% | 7.2% | 6.6% |
| 7 | Ireland↓ | 7.7% | 6.4% | 5.4% |
| 8 | Italy↑ | 4.1% | 4.4% | 4.9% |
| 9 | Netherlands↑ | 3.4% | 3.8% | 4.6% |
| 10 | Spain↑ | 2.5% | 2.6% | 2.7% |
| 11 | India↑ | 1.8% | 2.1% | 2.4% |
| 12 | Denmark↑ | 2.2% | 2.3% | 2.4% |
| 13 | Austria | 1.9% | 1.8% | 1.8% |
| 14 | Sweden↓ | 1.8% | 1.6% | 1.5% |
| 15 | Singapore | 1.3% | 1.5% | 1.4% |
| 16 | China | 1.2% | 1.3% | 1.3% |
| 17 | Israel↓ | 1.5% | 1.4% | 1.2% |
| 18 | Canada | 1.2% | 1.1% | 1.1% |
| 19 | Hungary | 1.0% | 1.0% | 1.0% |
| 20 | Australia | 0.8% | 1.0% | 0.7% |
Note: “↑”represents that the data listed continued to increase from 2011 to 2013, “↓”represents that the data listed continued to decrease from 2011 to 2013.
Among the above twenty export Countries, the market share of Italy, Netherlands, Spain, India and Denmark continued to increase from 2011 to 2013, the market share of Ireland, Sweden and Israel continued to decrease from 2011 to 2013.
Source: UN Comtrade


