China's Knitting Machinery Exports from Jan. to May, 2012
| HS Code | Product Name | Unit | Quantity | Value(U.S. dollars) | Year on Year Growth(±%) | |||
| Quantity | Value | |||||||
| 8447 | Knitting machines, stitch-bonding machines and thick pine spiral flower line, tulle, lace, embroidery, trimmings, braid or net and manufacturing machines and tufting machines (hereinafter referred to as "knitting machinery") | PCS | 50,994 | 226,767,337 | -26.9 | -15.7 | ||
| 8448 | Machine auxiliaries listed in 8444,8445,8446 or 8447 (hereinafter referred to as "assistive devices and spare parts) | - | 24,922,381 | 208,265,508 | -11 | -11.5 | ||
| 8445 |
Pretreatment machine of textile fibers; spinning machines and line machines, twisting machines and other machinery for textile yarn production; reeling machine, winder machine (including weft machine) and textile yarn pretreatment machine in 8446 or 8447 | PCS | 28,346 | 110,542,634 | 755.1 | 98.1 | ||
| 8444 | Chemical textile fiber extrusion, stretching, deformation or cutting machines | PCS | 4,294 | 108,850,292 | 6.8 | 8 | ||
| 8446 | Loom | PCS | 17,964 | 85,807,217 | 84.8 | 61 | ||
| 8449 | Shaped felt or nonwovens manufacturing or management machine, including the machine for making felt hats; cap mold | kg | 5,633,381 | 30,587,934 | 21.9 | 17.3 | ||
According to customs statistics, the accumulative export value of China’s knitting machinery was $ 227 million in the first five months of 2012, down 15.7%, ranking first, followed by the auxiliary device and spare parts, with exports of about $ 208 million, down 11.5%. The third was chemical textile fiber extrusion, drawing, texturing or cutting machine, whose export volume grew by 755.1% and export value increased by 98.1% over the previous year.
China's Knitting Machinery (HS: 8447) Export Quantity and Value from Jan. to May, 2012
| Month | Quantity (PCS) | Value (USD) | Year on year growth (±%) | |
| Quantity | Value | |||
| Jan. | 12,605 | 47,220,065 | -20 | -17.4 |
| Feb. | 5,568 | 31,195,054 | -49.1 | -10.2 |
| Mar. | 11,827 | 51,066,187 | -33 | -7.3 |
| Apr. | 9,274 | 43,109,662 | -27.3 | -32.2 |
| May | 11,720 | 54,176,369 | -7.4 | -7.3 |
| Total | 50,994 | 226,767,337 | -26.9 | -15.7 |
China's Knitting Machinery (HS: 8447) Exports (by Countries /Regions) from Jan. to May, 2012
| No. | Countries / Regions | Quantity(million ton) | Value(million USD) | Year on year growth (±%) | |
| Quantity | Value | ||||
| 1 | India | 66.07 | 5358 | -57.5 | -56.3 |
| 2 | Pakistan | 19.61 | 3141 | 31.2 | 48.4 |
| 3 | Bengal | 135.71 | 2480 | -47.9 | 45.7 |
| 4 | Indonesia | 25.50 | 1467 | 68.8 | 7.3 |
| 5 | Vietnam | 16.04 | 1082 | 45.7 | 58.2 |
| 6 | Russian Federation | 26.55 | 839 | 90.5 | 80.4 |
| 7 | The USA | 17.83 | 576 | -36.2 | 44.5 |
| 8 | Japan | 42.20 | 532 | -1.4 | -0.6 |
| 9 | Thailand | 13.84 | 530 | 110.7 | 29.6 |
| 10 | Turkey | 4.14 | 511 | 43.3 | 17.8 |
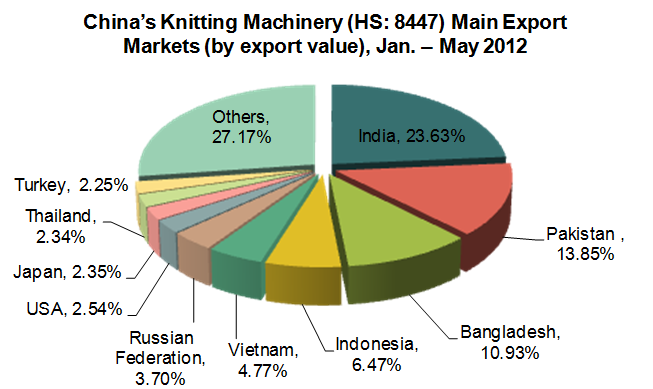
From Jan. to May 2012, in the view of export quantity, six in the top ten export destination countries / regions increased while the other four got negative growth. Seen from the year-on-year growth, countries achieved large increase were Thailand (up 110.7%), Russian Federation (up 90.5 percent) and Indonesia (up 68.8%), while India (down 57.5%) and Bangladesh country (down 47.9%) decreased largely. It is notable that Thailand had replaced Brazil to be one of the China's knitting machinery top ten destination countries / regions.
China's Main Export Catchments of Knitting Machinery(HS: 8447), Jan.-May 2012
| No. | Cities/Provinces | Quantity (PCS) | Value (USD) | Year-on-year growth (± %) | |
| Quantity | Value | ||||
| 1 | Zhejiang | 19,768 | 124,547,753 | -20.9 | -30.3 |
| 2 | Jiangsu | 14,177 | 27,982,363 | -40.1 | 7.2 |
| 3 | Guangdong | 6,562 | 23,343,417 | -16.3 | 25.2 |
| 4 | Fujian | 5,464 | 19,676,659 | -37.4 | -5.5 |
| 5 | Shanghai | 2,120 | 17,834,741 | -9.9 | 26.8 |
| 6 | Tianjin | 337 | 3,273,650 | 130.8 | 24 |
| 7 | Beijing | 142 | 2,680,992 | -30.4 | -4.1 |
| 8 | Shandong | 419 | 2,586,903 | -29.2 | 2 |
| 9 | Liaoning | 205 | 972,506 | -33.9 | 56.6 |
| 10 | Anhui | 90 | 947,866 | 0 | 27.6 |
| 11 | Chongqing | 45 | 798,112 | 4400 | 11514 |
| 12 | Hunan | 15 | 592,481 | 0 | 0 |
| 13 | Hubei | 472 | 327,376 | -20.5 | -56 |
| 14 | Hebei | 179 | 257,443 | -15.2 | 14 |
| 15 | Xinjiang | 17 | 135,339 | 54.5 | 141.7 |
| 16 | Heilongjiang | 21 | 116,900 | 320 | 145.7 |
| 17 | Inner Mongolia | 558 | 110,534 | 6100 | 754.3 |
| 18 | Jiangxi | 303 | 106,753 | 5960 | 306.1 |
| 19 | Jilin | 8 | 105,233 | -60 | 5161.7 |
| 20 | Shannxi | 13 | 99,315 | 550 | 298.4 |
Zhejiang, Jiangsu, Guangdong, Fujian and Shanghai are the top five export catchments of China's the knitting machinery. From Jan. to May 2012, total knitting machinery exports of the above provinces and cities accounted for 94.1% of China's total. However, all their export volume decreased to different extent, in which Jiangsu decreased most, by 40.1%.


