Export Quantity & Value of Chinese Extruding Machines in the first half of 2012
| Month | Export Quantity(Unit) | Export Value(USD Million) | Year on Year (±%) | |
|
|
|
| Quantity | Value |
| Jan. | 1,025 | 40.9 | 16 | 77.4 |
| Feb. | 384 | 15.3 | -26.2 | 13 |
| Mar. | 900 | 26.8 | 37.8 | 38 |
| Apr. | 1275 | 24.1 | 189.1 | 40.2 |
| May | 797 | 26.9 | 35.1 | 22.7 |
| Jun. | 727 | 32.2 | -2.5 | 53.9 |
| Total | 5,108 | 166.2 | 33.2 | 43.2 |
Major Importers of Chinese Extruding Machines in the first half of 2012
| No. | Countries/Regions | The First Half of 2012 | Year on Year (±%) | ||
|
|
| Export Quantity (Unit) | Export Value(USD Thousand) | Quantity | Value |
| 1 | Russian Federation | 329 | 18,714 | -14.5 | 77.3 |
| 2 | India | 241 | 11,635 | -39.1 | 35.2 |
| 3 | Indonesia | 449 | 10,963 | 98.7 | 144.2 |
| 4 | Thailand | 207 | 10,910 | 10.1 | 0.8 |
| 5 | Iran | 241 | 9,149 | 26.2 | 4.7 |
| 6 | Kazakhstan | 155 | 7,899 | 124.6 | 105 |
| 7 | Vietnam | 287 | 7,198 | -17.1 | 12.8 |
| 8 | Japan | 92 | 4,576 | 95.7 | 109.2 |
| 9 | Turkey | 85 | 4,535 | 51.8 | 7.8 |
| 10 | Germany | 111 | 4,415 | -16.5 | 90.4 |
| 11 | Saudi Arabia | 106 | 4,238 | 6 | 118.5 |
| 12 | Brazil | 145 | 4,005 | 64.8 | 14.9 |
| 13 | Taiwan, China | 76 | 3,379 | 43.4 | 93.6 |
| 14 | Malaysia | 292 | 3,150 | 210.6 | -31.1 |
| 15 | Mexico | 127 | 3,053 | 234.2 | 28.6 |
| 16 | Tanzania | 45 | 2,833 | 114.3 | 639.6 |
| 17 | Bangladesh | 74 | 2,745 | 164.3 | 167.4 |
| 18 | Argentina | 47 | 2,693 | 11.9 | 75.1 |
| 19 | Algeria | 122 | 2,526 | -9 | 45.5 |
| 20 | Uzbekistan | 115 | 2,384 | 161.4 | 172.1 |
Major Cities/Provinces of Chinese Extruding Machines Export in the first half of 2012
| No. | City/Province | The First Half of 2012 | Year on Year (±%) | Proportion of Export Value(%) | ||
|
|
| Export Quantity 9Unit) | Export Value (USD Thousand) | Quantity | Value |
|
| 1 | Jiangsu | 1,196 | 63,449 | 51.8 | 53.2 | 38.18% |
| 2 | Guangdong | 1024 | 34,889 | 52.6 | 38.1 | 20.99% |
| 3 | Shandong | 734 | 18,442 | 53.2 | 86.1 | 11.10% |
| 4 | Shanghai | 284 | 18,413 | 32.7 | 51.2 | 11.08% |
| 5 | Zhejiang | 1,340 | 14,557 | -0.7 | -9.4 | 8.76% |
In the first half of 2012, Chinese extruding machines achieved an export quantity of 5,108 units in total, with a rise of 33.2% year on year; and the export value reached .66 million dollars, up 43.2% year on year.
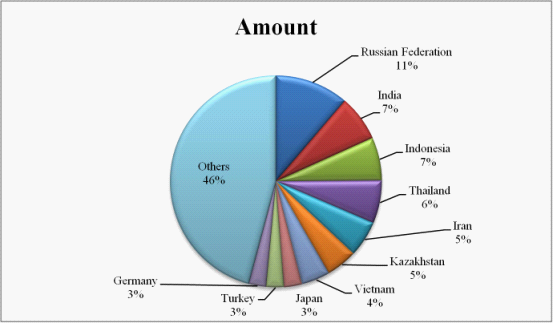
The major importers were Russian Federation, India, Indonesia, Thailand, Iran, Kazakhstan, Vietnam, Japan, Turkey and Germany and so on. In the first half of 2012, Chinese extruding machines export value for Russian Federation accounted for 11.26% of the total export value of Chinese extruding machines.
The Major exporting Cities/Provinces for Chinese extruding machines were as follows: Jiangsu, Guangdong, Shandong, Shanghai and Zhejiang, in which Jiangsu's cumulative export value of Chinese extruding machines occupied 38.177% of the total export value of Chinese extruding machines.


