China Holiday Supplies (HS: 9505) Export Trend Analysis from 2010 to 2012
Note:
HS Code:9505,Festive, carnival or other entertainment articles, including conjuring tricks and novelty jokes, hereafter referred to as "Holiday Supplies"
China Holiday Supplies Export Volume Trend from 2010 to 2012
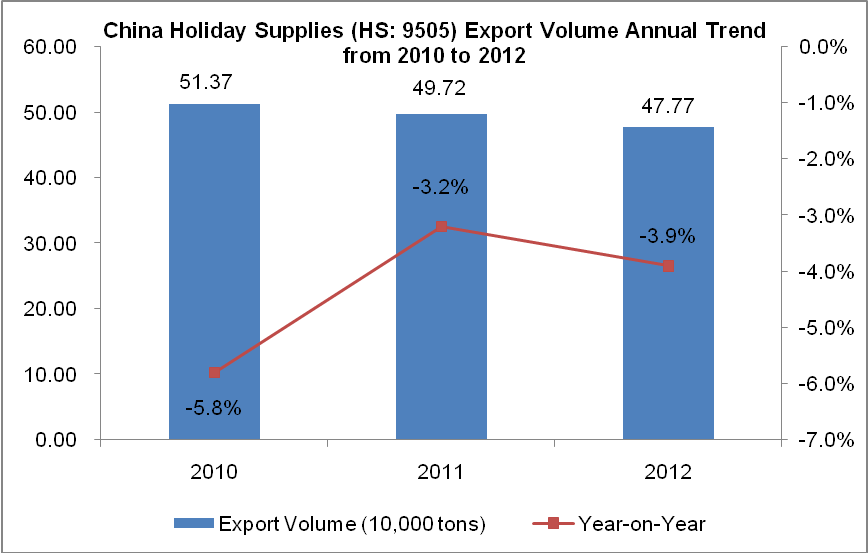
As can be seen from the above chart, China holiday supplies export volume declined year by year from 2010 to 2012. The export volume of 2012 amounted to 477,700 tons, with a decrease of 3.9% compared to the same period of 2011.
China Holiday Supplies Export Value Trend from 2010 to 2012
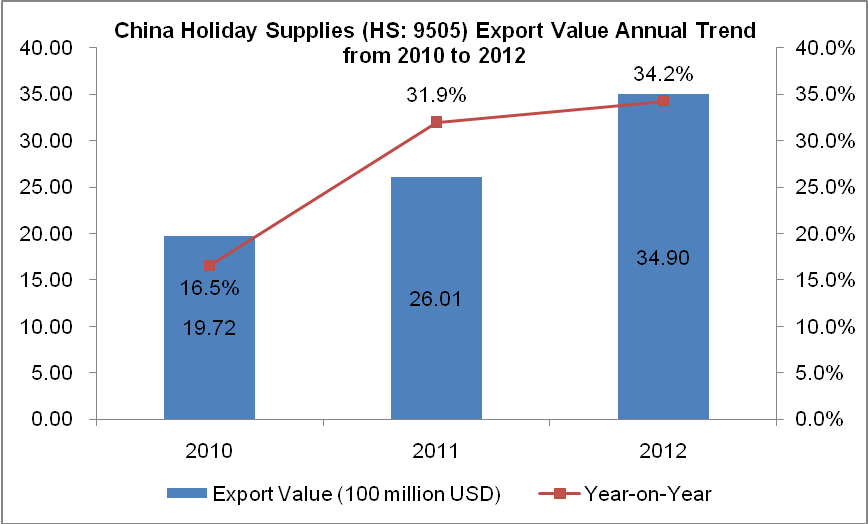
As can be seen from the above chart, China holiday supplies export value increased year by year from 2010 to 2012. The export value of 2012 amounted to 3.49 billion US dollars, with an increase of 34.2% compared to the same period of 2011.
China Holiday Supplies Export Volume Monthly Trend from 2010 to 2012
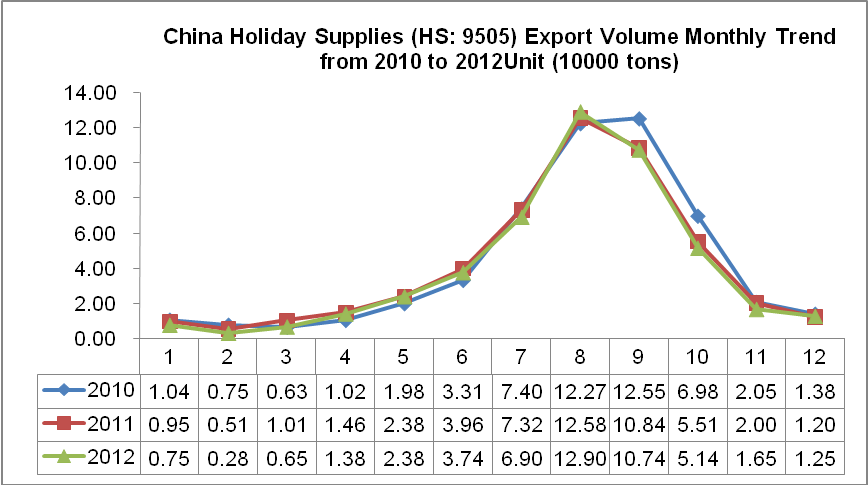
As can be seen from the above chart, China holiday supplies have the obvious pale busy season characteristic, and the exportation peak mainly concentrates from July to October.
China Holiday Supplies Export Value Monthly Trend from 2010 to 2012
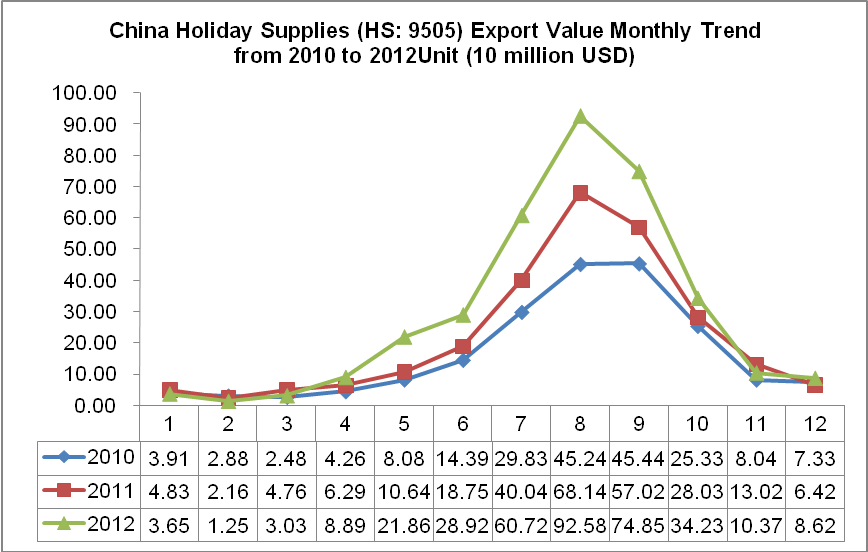
As can be seen from the China holiday supplies monthly export value chart, the export value of 2012 peaked in August and slumped in February.
China Holiday Supplies Monthly Average Export Unit Price Trend from 2010 to 2012
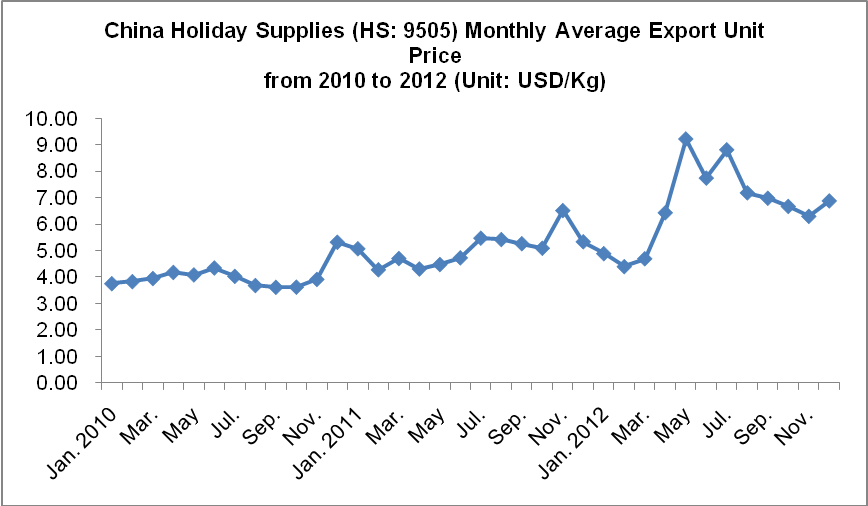
As can be seen from China holiday supplies monthly average export unit price from 2010 to 2012, the average unit price of 2012 is higher than the previous 2 years.
China Holiday Supplies Export Markets Analysis from 2010 to 2012
| No. | Countries/Regions | Export Value (USD) | Growth Compared 2012 to 2010 | ||
|
|
| 2010 | 2011 | 2012 |
|
| 1 | USA | 810,559,287 | 1,087,330,366 | 1,386,412,045 | 71.04% |
| 2 | UK | 139,291,704 | 184,518,084 | 207,207,833 | 48.76% |
| 3 | Netherlands | 99,735,263 | 124,179,060 | 170,891,275 | 71.34% |
| 4 | Canada | 82,925,307 | 103,834,931 | 150,018,643 | 80.91% |
| 5 | Germany | 94,983,267 | 131,334,501 | 148,320,167 | 56.15% |
| 6 | Brazil | 38,694,304 | 47,530,105 | 106,500,077 | 175.23% |
| 7 | Italy | 77,430,273 | 87,383,528 | 91,430,464 | 18.08% |
| 8 | The Russian Federation | 35,522,551 | 59,313,839 | 73,865,511 | 107.94% |
| 9 | Mexico | 30,940,103 | 37,213,848 | 69,166,830 | 123.55% |
| 10 | Australia | 33,560,699 | 36,364,627 | 64,694,824 | 92.77% |
| 11 | Singapore | 10,053,324 | 13,906,249 | 64,590,597 | 542.48% |
| 12 | Panama | 17,875,423 | 29,672,983 | 57,650,237 | 222.51% |
| 13 | France | 39,434,386 | 46,600,640 | 53,195,718 | 34.90% |
| 14 | Chile | 18,876,182 | 24,898,612 | 47,125,278 | 149.65% |
| 15 | Hong Kong | 37,461,031 | 34,812,956 | 44,771,185 | 19.51% |
| 16 | Japan | 39,582,685 | 42,834,348 | 44,248,857 | 11.79% |
| 17 | Belgium | 29,560,933 | 40,604,016 | 39,616,500 | 34.02% |
| 18 | Spain | 37,663,477 | 48,099,097 | 39,222,019 | 4.14% |
| 19 | Malaysia | 11,745,499 | 14,237,259 | 37,517,205 | 219.42% |
| 20 | Colombia | 13,311,639 | 19,409,208 | 27,929,465 | 109.81% |
The first three largest export markets of China holiday supplies are the USA, the UK and Netherlands. China's export value to USA, UK and Netherlands in 2012 is 1.386 billion US dollars, 27 million US dollars and 171 million US dollars separately, with an increase of 71.04%, 48.76% and 71.34% compared to 2010. Among the above twenty export markets, the export value of China to Singapore increased the largest, with an increase of 542.48% compared 2012 with 2010.
China Holiday Supplies Export Markets Share Analysis from 2010 to 2012
| No. | Countries/Regions | Value Percentage | ||
|
|
| 2010 | 2011 | 2012 |
| 1 | USA | 41.10% | 41.80% | 39.73% |
| 2 | UK | 7.06% | 7.09% | 5.94% |
| 3 | Netherlands | 5.06% | 4.77% | 4.90% |
| 4 | Canada | 4.21% | 3.99% | 4.30% |
| 5 | Germany | 4.82% | 5.05% | 4.25% |
| 6 | Brazil | 1.96% | 1.83% | 3.05% |
| 7 | Italy↓ | 3.93% | 3.36% | 2.62% |
| 8 | The Russian Federation | 1.80% | 2.28% | 2.12% |
| 9 | Mexico | 1.57% | 1.43% | 1.98% |
| 10 | Australia | 1.70% | 1.40% | 1.85% |
| 11 | Singapore↑ | 0.51% | 0.53% | 1.85% |
| 12 | Panama↑ | 0.91% | 1.14% | 1.65% |
| 13 | France↓ | 2.00% | 1.79% | 1.52% |
| 14 | Chile | 0.96% | 0.96% | 1.35% |
| 15 | Hong Kong↓ | 1.90% | 1.34% | 1.28% |
| 16 | Japan↓ | 2.01% | 1.65% | 1.27% |
| 17 | Belgium | 1.50% | 1.56% | 1.14% |
| 18 | Spain↓ | 1.91% | 1.85% | 1.12% |
| 19 | Malaysia | 0.60% | 0.55% | 1.08% |
| 20 | Colombia↑ | 0.68% | 0.75% | 0.80% |
Note: “↑”represents that the indicators listed continued to increase from 2010 to 2012, “↓”represents that the indicators listed continued to decrease from 2010 to 2012.
The data of 2012 shows that the United States, the United Kingdom and Netherlands, the first three largest export markets of China holiday supplies, accounted for 39.73%, 5.94% and 4.90% of the total export value of the same product of China separately.
Judging from the three-year market share, the import value in proportion of Singapore, and Panama and Colombia continued to rise, while that of Italy, France, Hong Kong, Japan and Spain continued to decline.
(Source: China Customs Network)

")

")

