China Non-Knitted or Non-Crocheted Apparel & Accessories Export Volume and Sales Statistics, from Jan. to Dec. 2014
| Month | Volume (-) | Value (USD) | Year-on-Year | |
| Volume | Value | |||
| Jan. | 1,519,325,645 | 7,960,509,128 | 30.30% | 33.80% |
| Feb. | 651,726,297 | 3,078,899,375 | -25% | -29.50% |
| Mar. | 990,718,003 | 4,549,767,506 | 34.50% | 35.50% |
| Apr. | 1,310,427,653 | 5,901,662,910 | 30.10% | 36.10% |
| May. | 1,400,204,178 | 6,470,262,483 | 28.30% | 34.60% |
| Jun. | 1,354,978,372 | 7,176,413,399 | 19.50% | 25% |
| Jul. | 1,536,944,681 | 8,923,911,517 | 23.80% | 26.50% |
| Aug. | 1,578,237,705 | 8,803,731,219 | 26.20% | 22.20% |
| Sep. | 1,387,808,610 | 7,719,160,273 | 17.50% | 17.20% |
| Oct. | 1,374,323,286 | 7,047,850,479 | 19.20% | 14.50% |
| Nov. | 1,296,851,952 | 6,414,880,872 | 14.2 | 6% |
| Dec. | 1,421,584,558 | 7,402,195,227 | 15.60% | 11.60% |
| Total from Jan. to Dec. | 15,823,130,940 | 81,449,244,388 | 19.90% | 19.30% |
The total export sales for China non-knitted or non-crocheted apparel & accessories, from Jan. to Dec. 2014, achieved 81.45 billion USD, and increased 19.3% year-on-year.
Top Countries/Regions That China Exports Non-Knitted or Non-Crocheted Apparel & Accessories to, from Jan. to Dec. 2014
| No. | Country/Region | Volume (-) | Value (USD) | Year-on-Year | |
| Volume | Value | ||||
| 1 | United States | 3,139,133,988 | 14,292,084,476 | 2.6% | 6.7% |
| 2 | Japan | 1,099,941,934 | 8,780,884,141 | -8.3% | -12.5% |
| 3 | United Kingdom | 697,425,659 | 4,623,319,062 | 24.9% | 35.3% |
| 4 | Germany | 703,742,120 | 4,425,674,937 | 5.9% | 12.5% |
| 5 | Russian Federation | 330,107,092 | 3,635,399,357 | 6.3% | 7.3% |
| 6 | Hong Kong | 822,717,159 | 3,167,895,634 | 67.2% | 4.3% |
| 7 | France | 434,061,093 | 2,692,378,178 | 5.9% | 21.6% |
| 8 | Vietnam | 444,248,888 | 2,581,771,360 | 167% | 229.7% |
| 9 | Netherlands | 374,824,545 | 2,395,639,894 | 26.1% | 38.9% |
| 10 | Republic of Korea | 321,653,794 | 2,348,105,905 | 7.3% | 16.4% |
| 11 | United Arab Emirates | 659,905,942 | 2,092,083,856 | 27% | 35% |
| 12 | Spain | 353,547,594 | 2,053,315,568 | 15.2% | 17.9% |
| 13 | Australia | 302,871,640 | 1,863,198,902 | 8.9% | 15.8% |
| 14 | Italy | 283,802,184 | 1,795,957,092 | 9.2% | 16.6% |
| 15 | Malaysia | 467,121,174 | 1,369,473,341 | 50.1% | 74.7% |
| 16 | Canada | 222,147,357 | 1,365,905,086 | -2.8% | -1.9% |
| 17 | Saudi Arabia | 234,188,449 | 1,146,189,128 | 27.1% | 73.4% |
| 18 | Chile | 219,139,888 | 1,124,214,862 | -2.7% | 4.2% |
| 19 | Brazil | 275,326,352 | 1,059,543,787 | 29.1% | 23.8% |
| 20 | Kazakhstan | 194,153,310 | 1,047,815,230 | 44.5% | 11.3% |

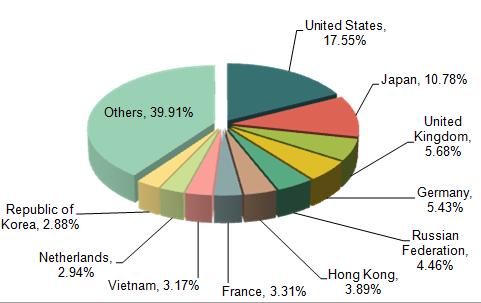
From Jan. to Dem. 2014 export data, we can include that top countries/regions that China exports non-knitted or non-crocheted apparel & accessories to are the United States, Japan, United Kingdom, Germany, Russian Federation, Hong Kong, France, Vietnam, Netherlands, Republic of Korea and etc.
Top three markets that China exports non-knitted or non-crocheted apparel & accessories to are the United States, Japan, and United Kingdom. The export value percentage to these three markets account for China total export value of knitted or crocheted apparel & accessories are 17.55%, 10.78% and 5.68% respectively.
From Jan. to Dec., the export value of exporting to Vietnam grows the fastest among the top 20 markets that China exports non-knitted or non-crocheted apparel & accessories to, which grows 229.7% compared to the same period of 2013.
Regions of Origin for Exported Chinese Non-Knitted or Non-Crocheted Apparel & Accessories, from Jan. to Dec. 2014
| No. | Region | Volume (-) | Value (USD) | Year-on-Year | ||
| Volume | Value | |||||
| 1 | Guangdong | 4,974,331,034 | 22,135,529,446 | 55.6% | 50.4% | |
| 2 | Jiangsu | 2,049,131,618 | 13,115,387,364 | -1.1% | 1% | |
| 3 | Zhejiang | 3,038,901,125 | 13,064,080,892 | 1% | 0.5% | |
| 4 | Shanghai | 804,613,071 | 5,124,854,175 | -6.8% | 0.1% | |
| 5 | Fujian | 718,989,342 | 4,675,377,133 | 18.1% | 21.9% | |
| 6 | Shandong | 708,213,812 | 4,537,434,483 | 6.9% | 6.9% | |
| 7 | Liaoning | 316,955,068 | 3,337,218,271 | 9.2% | 7% | |
| 8 | Hebei | 221,696,637 | 1,940,605,366 | 18.9% | 16.7% | |
| 9 | Xinjiang | 378,438,495 | 1,908,053,751 | 48.1% | 37.5% | |
| 10 | Jiangxi | 282,695,494 | 1,884,321,414 | 65.6% | 74.1% | |
Guangdong, Jiangsu, Zhejiang are the main original places of exported non-knitted or non-crocheted apparel & accessories, the export volume of these three provinces accounts for 63.59% of the total export volume of Chinese knitted or crocheted apparel & accessories, and export sales account for 59.32% of the total export sales of knitted or crocheted apparel & accessories. Among them, Guangdong export volume accounts for more than 31.44%; export sales account for 27.18%.
From Jan. to Dec., among top 10 regions of origin for exported Chinese non-knitted or non-crocheted apparel & accessories, Jiangxi export sales increased the most, which grows 74.1% compared to the same period of 2013.