Distribution of China Tubes, Pipes and Hollow Profiles of Iron or Steel Export Enterprises
| No. | Region | Export Value | Y-o-Y | ||
| Volume(kg) | Value(USD) | Volume | Value | ||
| 1 | Guangdong | 269,161,401 | 639,170,587 | 10.30% | 15.50% |
| 2 | Tianjin | 1,126,005,900 | 602,990,374 | 34.20% | 7.40% |
| 3 | Hebei | 541,162,683 | 299,967,381 | 28.90% | 1.60% |
| 4 | Jiangsu | 177,143,348 | 218,008,536 | 42.50% | 40.70% |
| 5 | Zhejiang | 72,965,124 | 163,914,574 | 16.30% | 32.20% |
| 6 | Liaoning | 269,853,678 | 158,974,523 | 6.40% | -15.60% |
| 7 | Shandong | 90,569,982 | 115,365,977 | -10% | 19.70% |
| 8 | Shanghai | 53,919,132 | 56,845,126 | -43.20% | -47.40% |
| 9 | Yunnan | 58,092,184 | 32,988,885 | 25.30% | 4.60% |
| 10 | Fujian | 35,109,871 | 29,336,154 | -21.50% | -41.90% |
From January to October, Guangdong province, Tianjin province and Hebei province were the major regions where China’s tubes, pipes and hollow profiles of iron or steel export enterprise located, among of which, the export value of Guangdong accounted for 25.8% of the total.
Distributions of Major Countries/Regions for China’s Tubes, Pipes and Hollow Profiles of Iron or Steel Export
| No. | Country/Region | Export Value | Y-o-Y | ||
| Volume(KG) | Value(USD) | Volume | Value | ||
| 1 | Thailand | 164,790,927 | 172,161,671 | 37.90% | 44% |
| 2 | Philippines | 177,242,832 | 130,492,708 | 53.70% | 49% |
| 3 | Myanmar | 146,337,849 | 103,023,616 | 71.10% | 44.40% |
| 4 | Australia | 112,796,538 | 98,915,889 | -2.10% | -15.30% |
| 5 | Indonesia | 77,747,291 | 86,636,607 | 6.50% | -2.10% |
| 6 | America | 57,430,755 | 83,085,132 | 43.60% | 27.80% |
| 7 | UAE | 134,604,413 | 82,837,730 | 78.90% | 21.50% |
| 8 | Singapore | 100,078,990 | 82,231,218 | 8.20% | -9.10% |
| 9 | Russia | 28,786,857 | 80,476,502 | 6.70% | 87.70% |
| 10 | Hong Kong | 78,645,549 | 75,343,599 | 9.30% | 25.60% |
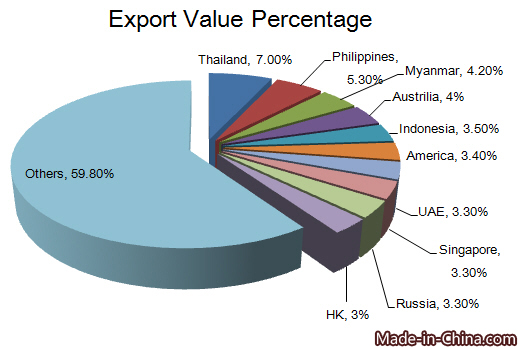
From January to October in 2015, Thailand, Philippines, Myanmar, Australia, Indonesia, America, UAE, Singapore, Russia and Hong Kong were major countries for China’s tubes, pipes and hollow profiles of iron or steel export. Thailand was the largest export market for China during this period. The value of tubes, pipes and hollow profiles China exported to Thailand accounted for 7% of the total.
Major Countries/Regions in Need of Tubes, Pipes and Hollow Profiles of Iron or Steel
| Importing Country/Region | Import Value | ||
| 2012 | 2013 | 2014 | |
| America | 4,749,432,000 | 4,014,520,000 | 4,650,870,000 |
| Germany | 2,078,095,000 | 2,108,164,000 | 2,129,330,000 |
| Canada | 1,517,142,000 | 1,292,970,000 | 1,470,981,000 |
| France | 942,198,000 | 908,697,000 | 872,423,000 |
| Mexico | 650,851,000 | 676,024,000 | 695,526,000 |
Unit: USD
From 2012 to 2014, major Tubes, pipes and hollow profiles of iron or steel importing countries were America, Germany, Canada, France and Mexico. As the largest importing country, America’s import value was USD 4651 million in 2014.
Major Tubes, Pipes and Hollow Profiles of Iron or Steel Exporting Countries
| Exporting Country/Region | Export Value | ||
| 2012 | 2013 | 2014 | |
| Italy | 3,562,817,000 | 3,483,293,000 | 3,737,916,000 |
| China | 2,448,872,000 | 2,504,873,000 | 2,867,008,000 |
| Korea | 2,263,654,000 | 2,115,329,000 | 2,799,071,000 |
| America | 2,041,047,000 | 1,882,759,000 | 2,014,914,000 |
| Germany | 1,710,909,000 | 1,714,917,000 | 1,783,608,000 |
Unit: USD
From 2012 to 2014, main tubes, pipes and hollow profiles of iron or steel exporting countries included Italy, China, Korea, America and Germany. As the largest exporting country, Italy’s export value reached USD 3738 million in 2014.China ranked second in the list and the export value of 2014 was USD 2867 million.


