China footwear is getting a brand status in the global market, sector insiders have said. The trade analysis is as below.
China Footwear, Gaiters and the like Export Trend From 2011 to 2014
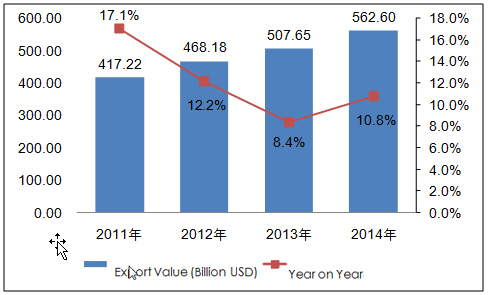
During this time, China footwear, gaiters and the like (hereafter called footwear) export had a tendency to increase and the export value in 2014 was USD 56.26 billion, up 34.8% than 2011.
China Footwear export volume & Value from Jan. to Sep. in 2015
| Month | Volume(kg) | Volume(USD) | Y-O-Y | |
| Volume | Value | |||
| Jan. | 470,123,164 | 5,696,661,556 | -13.60% | -10.90% |
| Feb. | 386,506,216 | 4,594,019,351 | 90.30% | 89.90% |
| Mar. | 193,332,044 | 2,309,098,893 | -33.80% | -26.80% |
| Apr. | 319,902,180 | 3,564,460,870 | -18.70% | -13.20% |
| May. | 393,843,398 | 4,536,938,703 | -5.90% | 0.70% |
| Jun | 424,067,669 | 5,139,664,783 | -4.40% | 3.10% |
| Jul. | 426,280,368 | 5,147,007,899 | -17.50% | -14.70% |
| Aug. | 445,086,053 | 5,250,703,746 | -9.90% | -10.90% |
| Sep. | 377,998,040 | 4,540,087,819 | -11.50% | -11.50% |
| Total | 3,437,139,132 | 40,778,643,620 | -7.90% | -4.30% |
From January to September in 2015, China’s footwear export value was USD 40.779 billion, down 4.3% on year.
Major countries for China’s footwear export from January to September in 2015
| No. | Country/Region | Volume(kg) | Value(USD) | Y-O-Y | |
| Volume | Value | ||||
| 1 | America | 761,720,339 | 10,910,983,976 | 4% | 3.10% |
| 2 | England | 192,366,944 | 2,060,456,394 | 7.40% | 7.60% |
| 3 | Japan | 163,784,694 | 1,914,046,593 | -10.10% | -8.90% |
| 4 | Germany | 125,557,904 | 1,547,682,025 | -18.60% | -15.10% |
| 5 | Russia | 91,188,982 | 1,436,389,445 | -40.10% | -41.30% |
| 6 | Kazakhstan | 74,588,467 | 1,162,601,367 | -35.80% | -30.20% |
| 7 | Hong Kong | 94,014,815 | 1,138,025,441 | -3.30% | -16.30% |
| 8 | UAE | 93,306,012 | 1,053,744,291 | 3.80% | 13.20% |
| 9 | Korea | 62,598,783 | 1,053,340,551 | -6.40% | 12.30% |
| 10 | Malaysia | 76,717,640 | 947,570,050 | -11.50% | 5.40% |
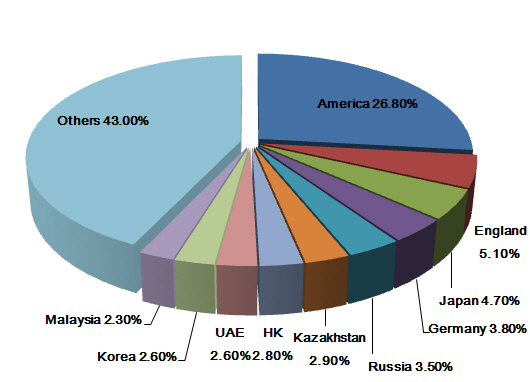
According to the export data, America, England, Japan, Germany, Russia, Kazakhstan, HK, UAE, Korea and Malaysia were the major regions for China’s footwear export. America topped the list of China’s largest footwear export market, followed by England and Japan. From January to September in 2015, China’s footwear exports to Philippines grew the fastest and the growth was 60 by year.
China’s Footwear Supply Sources from January to September in 2015
| No. | Region | Volume(kg) | Value(USD) | Y-O-Y | |
| Volume | Value | ||||
| 1 | Guangdong | 1,097,076,013 | 14,312,110,129 | -5.50% | -1.90% |
| 2 | Zhejiang | 907,914,597 | 8,093,838,802 | -8.70% | -4.10% |
| 3 | Fujian | 653,565,652 | 7,781,690,003 | -10.20% | -6.60% |
| 4 | Xinjiang | 138,205,622 | 1,942,430,344 | -22.90% | -14.80% |
| 5 | Jiangsu | 163,902,914 | 1,673,288,675 | -5% | -5% |
| 6 | Jiangxi | 106,658,055 | 1,481,028,634 | 14.70% | 20% |
| 7 | Shandong | 86,119,259 | 1,025,641,721 | 2.40% | 3.60% |
| 8 | Sichuan | 31,680,718 | 602,655,396 | -30.10% | -35.80% |
| 9 | Hunan | 26,166,568 | 511,772,909 | 24.50% | 28.80% |
| 10 | Shanghai | 39,154,858 | 469,592,001 | -11.20% | -14.90% |
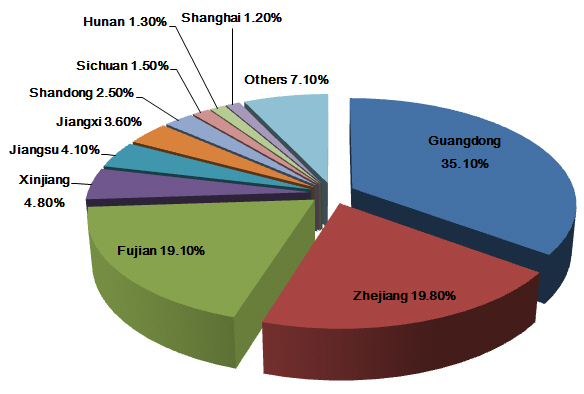
Guangdong, Zhejiang and Fujian are the major supply sources for footwear export. From January to September, the three provinces’ footwear export volume accounted for 77.4% of the total during this time.
Chongqing’s export value increased 97.7% by year, having the fastest growth. Jiangxi has the highest export price of 21.4 USD/kg and Zhejiang has the lowest of 8.91 USD/kg.


