Main Exporting Countries / Regions of China Fish, Crustaceans, Molluscs and Other Aquatic Invertebrates (by Export Value), from Jan. to Dec. 2014
| No. | Countries/Regions | Jan. to Dec. | Year on Year | ||
| Volume (kg) | Value (USD) | Volume | Value | ||
| 1 | Japan | 388,506,433 | 2,000,307,903 | 6.80% | 0.10% |
| 2 | USA | 373,339,545 | 1,878,454,285 | 2.20% | 8.10% |
| 3 | Hong Kong | 175,908,416 | 1,794,782,024 | 4% | 20.90% |
| 4 | Republic of Korea | 407,143,793 | 1,366,231,522 | 21.10% | 20% |
| 5 | Taiwan | 90,452,383 | 907,507,352 | 7.30% | 16.30% |
| 6 | Thailand | 140,607,820 | 687,371,494 | 36.80% | 68.80% |
| 7 | Malaysia | 71,689,214 | 644,042,908 | 15% | 37% |
| 8 | Germany | 132,332,275 | 464,864,266 | -2.30% | -0.10% |
| 9 | Philippines | 124,294,452 | 373,415,683 | 8.80% | 26.70% |
| 10 | United Kingdom | 69,205,327 | 299,089,425 | 3.20% | 5.80% |
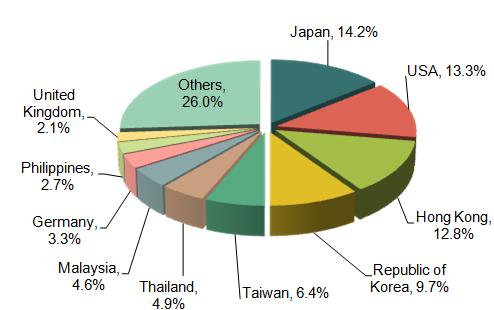
From 2014 January-December the original places of exported fish, crustaceans, molluscs and other aquatic invertebrates are Japan, USA, Hong Kong, Korea, Taiwan, Thailand, Malaysia, Germany, the Philippines and the United Kingdom. Japan is China’s major export market of fish, crustaceans, molluscs and other aquatic invertebrates main. the export value to Japan accounted for 14.2% of China's total exports of such products.
China Edible Vegetables, Roots and Tubers major Exporting Countries / Regions (by Export Value), from Jan. to Dec. 2014
| No. | Countries/Regions | Jan. to Dec | Year on Year | ||
| Volume (kg) | Value (USD) | Volume | Value | ||
| 1 | Japan | 1,001,928,800 | 1,302,545,510 | 1.9% | 1.3% |
| 2 | Viet Nam | 620,771,976 | 1,259,005,432 | 4% | 55.3% |
| 3 | Hong Kong | 851,122,177 | 848,278,948 | -3.5% | 28.4% |
| 4 | Malaysia | 631,389,544 | 586,697,366 | 2.8% | 0.8% |
| 5 | Thailand | 369,418,806 | 489,405,192 | -1.1% | -12.2% |
| 6 | Republic of Korea | 522,010,388 | 479,413,664 | -15.3% | -2.1% |
| 7 | USA | 272,379,204 | 468,389,634 | 2.1% | 4.9% |
| 8 | Indonesia | 558,309,036 | 392,928,058 | 11% | -4.6% |
| 9 | Russian Federation | 546,707,955 | 333,615,989 | 32.9% | 36.5% |
| 10 | Brazil | 136,772,346 | 150,030,881 | -62.5% | -59.7% |
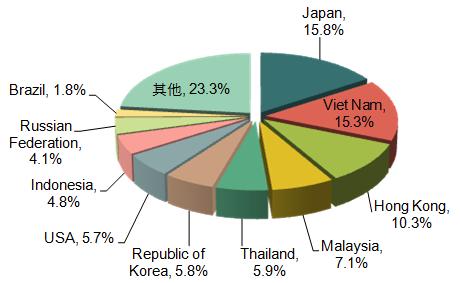
From January to December 2014, the original places of exported vegetables, roots and tubers are Japan, Vietnam, Hong Kong, Malaysia, Thailand, South Korea, USA, Indonesia, the Russian Federation and Brazil. Japan is China's major export market of vegetables, roots. The export value accounted for 15.8 percent of china's total exports of such products. From January to December 2014, the export value of China's exported vegetables, roots and tubers to Brazil fell by 59.7% year on year.
China Edible Fruit and Nuts; Melons or Citrus Fruit Peels Main Exporting Countries / Regions (by Export Value), from Jan. to Dec. 2014
| No. | Countries/Regions | Jan. to Dec | Year on Year | ||
| Volume (kg) | Value (USD) | Volume | Value | ||
| 1 | Thailand | 313,981,447 | 643,713,166 | -3.4% | 9.6% |
| 2 | Vietnam | 453,190,161 | 553,902,843 | -0.8% | 15.2% |
| 3 | Indonesia | 273,098,315 | 366,436,309 | -7.4% | 16.3% |
| 4 | Russian Federation | 316,221,766 | 324,044,926 | -4.5% | 2.9% |
| 5 | Malaysia | 185,868,426 | 318,863,842 | -33.3% | -29.1% |
| 6 | Hong Kong | 202,050,976 | 287,677,723 | -7.2% | 80.8% |
| 7 | Japan | 54,937,500 | 183,660,615 | -19.2% | -7.7% |
| 8 | Philippines | 125,695,682 | 182,162,241 | -33.6% | -26.1% |
| 9 | USA | 30,078,134 | 147,451,924 | 15.1% | 3.7% |
| 10 | Kazakhstan | 150,162,743 | 136,787,945 | -9.1% | -4.8% |
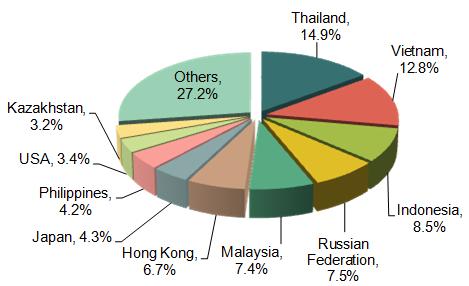
From 2014 January-December the major export countries/regions of fruit and nuts; melons or citrus fruit peels are Thailand, Vietnam, Indonesia, the Russian Federation, Malaysia, Hong Kong, Japan, the Philippines, USA and Kazakhstan. Thailand is China's major export market of fruit and nuts; melons or citrus fruit peel, export value to Thailand accounted for 14.9% of china’s total exports of such products. Among the top 10 export markets, the export value to Malaysia fell by 29.1 percent significantly.
China Meat, Fish, Crustaceans, Molluscs and Other Aquatic Invertebrates Products Main Exporting Countries / Regions (by Export Value), from Jan. to Dec. 2014
| No. | Countries/Regions | Jan. to Dec | Year on Year | ||
| Volume (kg) | Value (USD) | Volume | Value | ||
| 1 | Japan | 523,826,954 | 2,941,566,827 | -1.4% | -5.4% |
| 2 | USA | 198,270,550 | 1,411,133,918 | 3.2% | 5.8% |
| 3 | Hong Kong | 148,329,356 | 1,079,549,653 | -1.8% | -3.1% |
| 4 | Taiwan | 28,801,677 | 533,962,484 | 14.8% | 46.6% |
| 5 | Russian Federation | 38,279,242 | 368,515,656 | 10.6% | -0.4% |
| 6 | Republic of Korea | 79,982,362 | 275,310,543 | 12.7% | 4.4% |
| 7 | Mexico | 33,850,513 | 217,512,968 | 16.1% | 5.8% |
| 8 | Malaysia | 40,441,772 | 204,471,776 | -19.6% | -35% |
| 9 | Thailand | 25,663,290 | 170,187,367 | -5.9% | -21.7% |
| 10 | Australia | 18,348,642 | 161,007,901 | -3.9% | 1.3% |
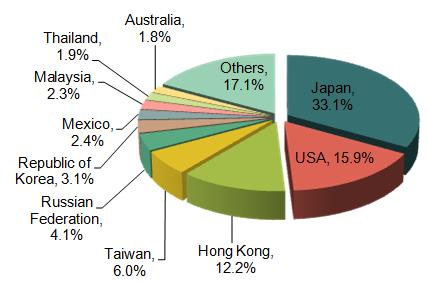
From January to December 2014, China's major export countries/regions of meat, fish, crustaceans, molluscs and other aquatic invertebrates products are Japan, USA, Hong Kong, Taiwan, Russia, South Korea, Mexico, Malaysia, Thailand and Australia. Japan is china’s major market of meat, fish, crustaceans, molluscs and other aquatic invertebrates products. The export value to Japan accounted for 33.1 percent of total exports of such products.
China Vegetables, Fruit, Nuts or Other Parts of Plants Products Main Exporting Countries / Regions (by Export Value), from Jan. to Dec. 2014
| No. | Countries/Regions | Jan. to Dec | Year on Year | ||
| Volume (kg) | Value (USD) | Volume | Value | ||
| 1 | Japan | 831,505,534 | 1,788,092,093 | -6% | -8.1% |
| 2 | USA | 719,988,770 | 1,081,745,968 | -15.3% | -14.7% |
| 3 | Republic of Korea | 416,998,132 | 617,905,162 | -2.7% | 17.8% |
| 4 | Russian Federation | 297,444,066 | 440,807,046 | 4.3% | 10.2% |
| 5 | Germany | 120,787,172 | 238,194,108 | -12.1% | 3.8% |
| 6 | Malaysia | 100,779,961 | 230,074,229 | 3% | 13.9% |
| 7 | Thailand | 87,668,029 | 204,469,283 | -16.8% | -10% |
| 8 | Hong Kong | 55,819,557 | 170,357,287 | -4.2% | 3.6% |
| 9 | Taiwan | 40,075,130 | 154,409,616 | -1% | 9.4% |
| 10 | Canada | 84,827,234 | 147,071,578 | -7.5% | -7% |
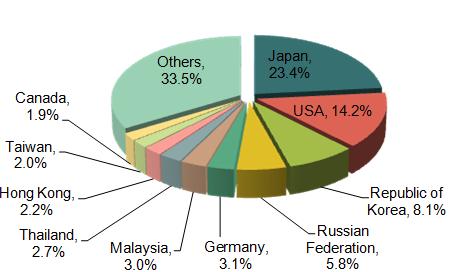
From January to December 2014, the major export countries/regions of vegetables, fruit, nuts or other parts of plants products are Japan, USA, South Korea, Russia, Germany, Malaysia, Thailand, Hong Kong, Taiwan and Canada. Japan is the major export market of vegetables, fruit, nuts and other parts of plants products. The export value to Japan accounted for 23.4% of total exports of such products
China Food Industry Residues and Waste; and the Preparation of Animal Feed Main Exporting Countries / Regions (by Export Value), from Jan. to Dec. 2014
| No. | Countries/Regions | Jan. to Dec | Year on Year | ||
| Volume (kg) | Value (USD) | Volume | Value | ||
| 1 | Japan | 1,498,373,007 | 837,194,557 | 42.1% | 35.7% |
| 2 | Republic of Korea | 1,205,484,642 | 488,606,019 | -11.5% | 7.9% |
| 3 | USA | 161,324,247 | 434,482,360 | -2.3% | -11.1% |
| 4 | Vietnam | 360,121,341 | 261,716,559 | 81.7% | 72% |
| 5 | Indonesia | 260,505,857 | 164,874,604 | 437.9% | 433.2% |
| 6 | Netherlands | 144,992,983 | 133,500,898 | 3.4% | 1.9% |
| 7 | Germany | 24,811,839 | 115,276,436 | 61.6% | 17.8% |
| 8 | Malaysia | 117,597,977 | 85,253,375 | 74.5% | 68.7% |
| 9 | United Kingdom | 37,824,444 | 68,568,464 | -14.4% | 2.2% |
| 10 | Russian Federation | 55,085,442 | 53,952,040 | 25.4% | 14% |
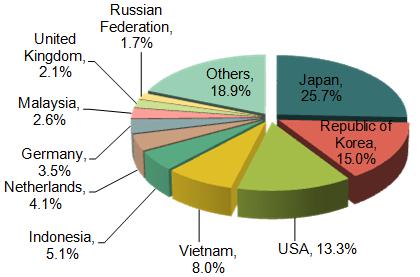
From 2014 January-December major export countries of China food industry residues and waste; and animal feed formulated are Japan, South Korea, USA, Vietnam, Indonesia, the Netherlands, Germany, Malaysia, the United Kingdom and the Russian Federation. Japan is the major export market of China's food industry residues and waste; animal feed preparation, the export value of which accounted for 25.7% of the country's total merchandise exports. From January to December 2014, among the top 10 largest export market for China's food industry residues and waste; animal feed preparation of animal feed, the exports to Indonesia grew by 433.2%.
Source: Customs Information Network


