Note:
| HS Code | Product Name |
| 9207 | Musical instruments, the sound of which is produced or must be amplified electrically (for example, organs, guitars, accordions), the following article hereinafter referred to as "electric instrument" |
China Electric Instrument Export Volume and Value from Jan. to October in 2013
| Month | Volume (Set) | Value (USD) | Compared to the Same Period of Last Year | |
|
|
|
| Volume | Value |
| January | 1,021,138 | 55,100,686 | 120.3% | 72.6% |
| February | 312,917 | 23,693,466 | 5.5% | 2.1% |
| March | 394,257 | 29,755,878 | -22.1% | -23.4% |
| April | 487,791 | 36,620,858 | -3.9% | -16% |
| May | 538,689 | 36,274,770 | -16.8% | -24.4% |
| June | 545,050 | 39,067,730 | -22.5% | -24.1% |
| July | 737,352 | 52,403,348 | 6% | 1% |
| August | 771,859 | 53,300,451 | -19.3% | -11.8% |
| September | 856,408 | 54,830,246 | -23.9% | -14.9% |
| October | 852,496 | 56,900,200 | -5.4% | 0.8% |
| Jan. to October Total | 6,517,957 | 437,947,633 | -4.2% | -6.9% |
The export volume of China electric instrument from Jan. to October in 2013 amounted to 6.518 million sets, with a decrease of 4.2%, while the export value amounted to 438 million US dollars, with a decrease of 6.9%.
China Electric Instrument Major Export Countries/Regions Distribution from Jan. to October in 2013
| No. | Countries | Volume (Set) | Value (USD) | Compared to the Same Period of Last Year | |
|
|
|
|
| Volume | Value |
| 1 | USA | 1,746,467 | 129,159,228 | -8.5% | -4.6% |
| 2 | Germany | 600,016 | 44,842,622 | -1.2% | -4.4% |
| 3 | Japan | 412,661 | 41,316,350 | -12% | -16.7% |
| 4 | UK | 327,348 | 19,377,906 | 39.3% | 15.6% |
| 5 | Netherlands | 190,970 | 16,693,063 | -14.9% | -22.8% |
| 6 | Hong Kong | 228,530 | 16,679,142 | -48.8% | -35% |
| 7 | France | 144,501 | 13,151,955 | -9.4% | -13.4% |
| 8 | Brazil | 242,083 | 12,838,929 | -16.8% | -24.5% |
| 9 | South Korea | 92,239 | 11,671,760 | -0.7% | -4.9% |
| 10 | Australia | 185,854 | 10,868,318 | 41% | 17.6% |
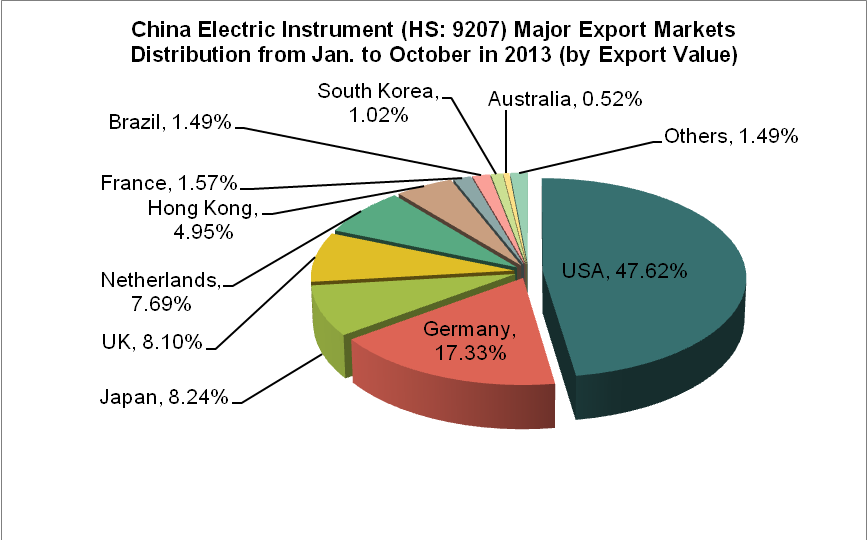
China's main export markets of electric instrument were the United States, Germany and Japan from Jan. to October in 2013. The export value to the three countries/regions accounted for 29.49%, 10.24% and 9.43% of our country's total export value of the product respectively and totally accounted for 49.17%.
China Electric Instrument Export Source Areas from Jan. to October in 2013
| No. | Regions | Volume (Set) | Value (USD) | Compared to the Same Period of Last Year | |
|
|
|
|
| Volume | Value |
| 1 | Guangdong | 3,497,889 | 208,551,409 | -1.3% | -2.3% |
| 2 | Tianjin | 908,715 | 75,904,849 | -4.1% | -6.1% |
| 3 | Jiangsu | 369,416 | 36,076,484 | 11.8% | -9.9% |
| 4 | Shandong | 399,578 | 35,489,685 | -19% | -13.7% |
| 5 | Shanghai | 230,441 | 33,674,023 | -32.5% | -28.4% |
| 6 | Zhejiang | 620,589 | 21,675,191 | -5.7% | 28.5% |
| 7 | Fujian | 118,744 | 6,854,328 | -52.9% | -46.6% |
| 8 | Anhui | 140,805 | 6,504,590 | 279.4% | 285.1% |
| 9 | Chongqing | 102,598 | 4,449,825 | 71% | -15.7% |
| 10 | Heilongjiang | 13,687 | 2,262,634 | -4.4% | -5.5% |
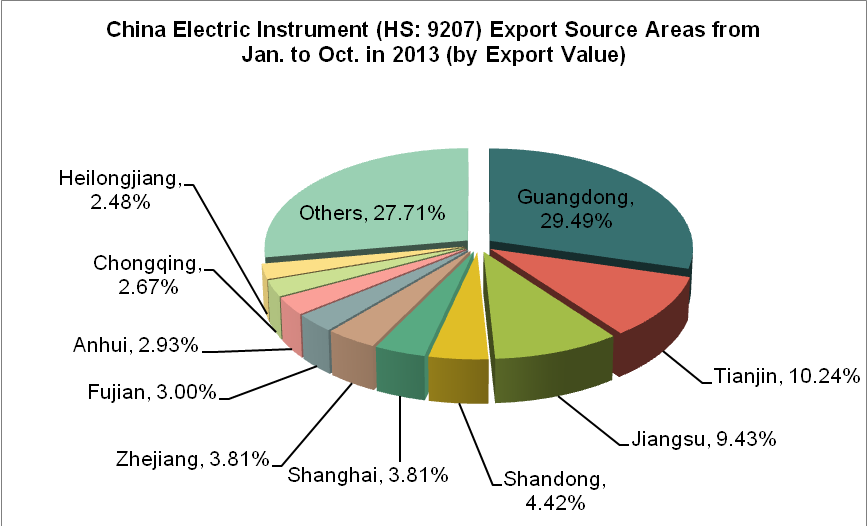
Guangdong and Tianjin are our country's electric instrument major export source areas. From Jan. to October in 2013, the export value of the above two areas totally accounted for 64.95% of the total export value of the product. Among the top ten our country's export source areas of electric instrument, the export volume and value of Anhui increased the largest rate. The export volume increased by 279.4% year on year, while the export value increased by 285.1% year on year.
(Source: Customs Information Network)


