2014 Jan. to Jun. Chinese Electric Wire and Cable Export Volume and Value
| Month | Volume (Kg) | Value ($) | Year on Year | |
| Volume | Value | |||
| Jan. | 200,100,374 | 1,921,030,289 | 17.8% | 26.7% |
| Feb. | 108,125,032 | 1,117,696,242 | -13.1% | -7.5% |
| Mar. | 174,663,195 | 1,746,912,115 | 13.2% | 16.3% |
| Apr. | 204,184,311 | 1,998,376,140 | 19.2% | 25.8% |
| May. | 203,557,419 | 1,939,075,849 | 14.6% | 20.1% |
| Jun. | 193,675,569 | 1,816,808,310 | 16.8% | 19.6% |
| Total | 1,084,305,900 | 10,539,898,945 | 12.5% | 17.8% |
From Jan. to Jun. in 2014, the export volume of Chinese electric wire and cable was 1.0843 million tons, increased 12.5% year on year. And the export value amounted to 10.54 billion dollars, increased 17.8% year on year. Except February, the export volume and value of the other five months all increased to some extent.
2014 Jan. to Jun. Chinese Electric Wire and Cable Major Export Countries/ Regions
| No. | Countries / Regions | Volume (Kg) | Value ($) | Year on Year | |
| Volume | Value | ||||
| 1 | Hong Kong | 119,045,882 | 2,299,414,823 | 23.5% | 37.1% |
| 2 | USA | 166,468,957 | 1,595,334,927 | 8.4% | 14.4% |
| 3 | Japan | 58,244,763 | 1,277,443,146 | 3.3% | 8.1% |
| 4 | Republic of Korea | 69,089,052 | 848,870,551 | 11.3% | 17.2% |
| 5 | Singapore | 30,618,732 | 238,441,346 | 19.3% | 19.8% |
| 6 | Australia | 37,361,133 | 237,211,475 | -7.9% | -7.8% |
| 7 | Germany | 23,835,390 | 200,416,225 | 10.4% | 18.4% |
| 8 | Thailand | 31,139,618 | 195,734,223 | 9.3% | 7.8% |
| 9 | Indonesia | 26,581,228 | 194,485,521 | -2% | 9.9% |
| 10 | India | 31,280,186 | 192,829,030 | 26.7% | 38.8% |
| 11 | Viet Nam | 21,012,712 | 190,539,446 | 54.1% | 30.6% |
| 12 | United Kingdom | 24,621,930 | 182,115,806 | 14.8% | 21.7% |
| 13 | Philippines | 22,721,803 | 138,947,751 | 30.4% | 26% |
| 14 | United Arab Emirates | 29,115,196 | 136,008,614 | 13.7% | 6.7% |
| 15 | Malaysia | 18,372,041 | 135,281,126 | -14% | -28.7% |
| 16 | Netherlands | 13,223,330 | 118,239,455 | 12.4% | 21.9% |
| 17 | Mexico | 10,554,806 | 106,512,787 | 4.4% | 9.5% |
| 18 | Brazil | 15,408,657 | 105,464,492 | -11.3% | 0.4% |
| 19 | Canada | 10,315,317 | 105,151,416 | -17.5% | -11.8% |
| 20 | Taiwan | 7,821,113 | 104,334,781 | -3.8% | 10% |
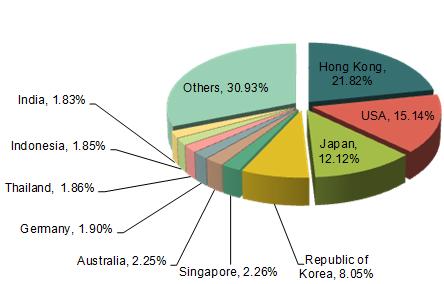
As can be seen from the export statistics from Jan. to Jun. in 2014, the major export markets for Chinese electric wire and cable were Hong Kong, USA, Japan, Republic of Korea, Singapore, Australia, Germany, Thailand, Indonesia and India, etc.
The first three largest export markets for Chinese electric wire and cable were Hong Kong, USA and Japan, whose export value accounted for 21.82%, 15.14% and 12.12% of the total export value respectively.
2014 Jan. to Jun. Chinese Electric Wire and Cable Export Sources
| No. | Regions | Volume (Kg) | Value($) | Year on Year | |
| Volume | Value | ||||
| 1 | Guangdong | 327,446,293 | 3,870,124,614 | 14.1% | 7.8% |
| 2 | Jiangsu | 173,222,563 | 1,560,285,103 | 14.4% | 21% |
| 3 | Zhejiang | 289,426,975 | 1,471,468,248 | 8.9% | 13.1% |
| 4 | Shandong | 84,148,098 | 905,579,416 | 9.8% | 5.6% |
| 5 | Shanghai | 47,362,382 | 752,964,903 | 7.2% | 48% |
| 6 | Fujian | 16,627,610 | 334,168,445 | 8% | 25.5% |
| 7 | Jiangxi | 9,894,901 | 281,806,944 | 26% | 185.8% |
| 8 | Tianjin | 9,875,239 | 163,935,574 | -4.1% | 0.7% |
| 9 | Liaoning | 10,635,949 | 153,152,672 | 42.9% | 24.1% |
| 10 | Hebei | 20,602,830 | 148,134,831 | 39.1% | 38.5% |
As can be seen from the export statistics from Jan. to Jun. in 2014, the major export sources for Chinese electric wire and cable were Guangdong, Jiangsu and Zhejiang. The total export value of the above three provinces accounted for 65.48% of the total export value of these products. Among them, Guangdong’s export value accounted for 36.72%. Compared to the same period of last year, Jiangxi’s accumulative export value amounted to 0.282 billion dollars from Jan. to Jun. in 2014, which showed the fastest increase of 185.8%.
Source: China Customs


