China Industrial Equipment & Components Industry Export Trend Analysis
| HS Code | Product name |
| 8414 | air pump or vacuum pump, air compressor, fan, air bleeder, whether with or without filters,simply call “vacuum pump” below |
| 8421 | centrifuge,including Centrifugal desiccant; Liquid / air filter or similar equipment,simply call “centrifuge” below |
| 8481 | Faucet used in pipe, furnace, container or barrel, valve and similar equipment ,including pressure reducing valve and Thermostatic control valve,simply call “valve and similar equipment” below |
| 8482 | antifriction bearing |
From Jan. to Dec. 2013 China Vacuum Pump(HS: 8414)Export Trend Analysis
From Jan. to Dec. 2013 China Vacuum Pump Export Volume and Value
| Month | Quantity(-) | Amount(USD) | Year-on-Year | |
|
|
|
| Quantity | Amount |
| Jan. | 102,770,810 | 995,004,024 | 13.8% | 18.8% |
| Feb. | 73,979,097 | 799,911,652 | 4.2% | 17.2% |
| Mar. | 97,595,323 | 1,078,750,895 | -10% | 5.8% |
| Apr. | 109,601,324 | 1,165,629,890 | 1.1% | 11.8% |
| May | 114,447,718 | 1,205,071,553 | 1% | 8.7% |
| Jun. | 101,338,954 | 1,025,669,044 | 1.7% | 4.7% |
| Jul. | 95,115,079 | 982,136,785 | 7.8% | 17.8% |
| Aug. | 90,131,302 | 882,938,449 | 3.8% | 12.7% |
| Sep. | 87,318,382 | 824,080,724 | -0.2% | 7.3% |
| Oct. | 82,459,595 | 770,597,222 | 7.3% | 11.7% |
| Nov. | 90,549,371 | 856,695,382 | 15.9% | 21.4% |
| Dec. | 95,971,066 | 957,377,360 | 8.4% | 12.6% |
| total | 1,141,278,021 | 11,543,862,980 | 4% | 12% |
From Jan. to Dec. 2013, China vacuum pump export Amount is 115.44 hundred million USD,increasing by 12% compared the same period in 2012.
From Jan. to Dec. 2013 China Vacuum Pump Major Export Countries/Regions Distribution
| No. | Country | Quantity(-) | Amount(USD) | Year-on-Year | |
|
|
|
|
| Quantity | Amount |
| 1 | USA | 160,514,139 | 2,077,435,691 | 6.2% | 9.8% |
| 2 | Japan | 83,919,925 | 935,050,444 | -0.2% | -3.7% |
| 3 | Hong Kong | 255,126,153 | 851,967,936 | 0.1% | 3.2% |
| 4 | India | 39,858,933 | 552,773,326 | -8.4% | 1.9% |
| 5 | Thailand | 34,759,618 | 495,778,282 | 4.5% | 9.6% |
| 6 | Republic of Korea | 41,022,859 | 485,143,972 | 24.9% | 28% |
| 7 | Brazil | 28,999,244 | 336,658,459 | 21.4% | 35.8% |
| 8 | Turkey | 16,279,117 | 307,446,480 | 30.6% | 21.4% |
| 9 | Indonesia | 35,624,485 | 305,436,684 | -20.4% | 25.7% |
| 10 | Malaysia | 24,261,026 | 301,717,957 | 3.3% | 20.6% |
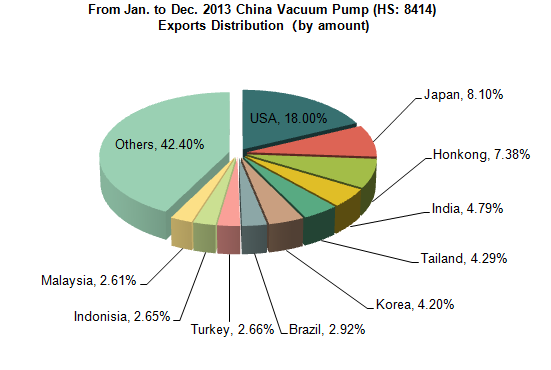
USA is the largest exporting market of Chinese vacuum pump. From Jan. to Dec. 2013,our vacuum pump exports amount to USA is 20.77 hundred million USD, with an increase of 9.8%, accounting for 18% of China's total exports amount. The second is Japan, accounting for 8.1% market share.
From Jan. to Dec. 2013 China Vacuum Pump Original Places of Exported Goods
| No. | Region | Quantity(-) | Amount(USD) | Year-on-Year | |
|
|
|
|
| Quantity | Amount |
| 1 | Guangdong | 552,925,609 | 4,705,881,147 | 2.3% | 11.5% |
| 2 | Jiangsu | 108,878,607 | 1,749,646,184 | 4.8% | 12.8% |
| 3 | Zhejiang | 194,917,661 | 1,599,669,261 | 10.6% | 16.6% |
| 4 | Shanghai | 103,021,926 | 1,235,075,853 | 2.9% | 4.8% |
| 5 | Shandong | 18,814,421 | 435,580,514 | 5.4% | 18.9% |
| 6 | Liaoning | 25,650,567 | 356,224,642 | -6.6% | 4.9% |
| 7 | Tianjin | 14,610,489 | 329,215,201 | 12.2% | 3.2% |
| 8 | Beijing | 3,228,959 | 209,224,108 | 2.9% | 26.4% |
| 9 | Hubei | 5,482,628 | 159,416,081 | 11.9% | 28.3% |
| 10 | Fujian | 38,174,539 | 140,016,875 | 25.2% | 11.6% |
Guangdong, Jiangsu, Zhejiang and Shanghai are the main original places of vacuum pump. From Jan. to Dec. 2013, the vacuum pump export volume from these four provinces accounted for 84.09% of China's total export volume. The vacuum pump export amount from these four provinces accounted for 84.09% of China's total export amount.
From Jan. to Dec. 2013 China Centrifuge(HS: 8421)Export Trend Analysis
From Jan. to Dec. 2013 China Centrifuge Export Volume and Value
| Month | Quantity(-) | Amount(USD) | Year-on-Year | |
|
|
|
| Quantity | Amount |
| Jan. | 62,798,733 | 369,658,131 | 9.7% | 22.7% |
| Feb. | 48,068,143 | 289,581,955 | 45.5% | 31.8% |
| Mar. | 50,102,695 | 336,194,141 | -9.6% | 16.3% |
| Apr. | 62,331,623 | 389,205,776 | 8.6% | 31.5% |
| May | 69,052,435 | 380,555,929 | 5.6% | 13.6% |
| Jun. | 63,332,577 | 356,063,617 | 0.6% | 3.4% |
| Jul. | 77,383,247 | 428,758,400 | 23.4% | 33.4% |
| Aug. | 79,333,137 | 413,158,572 | 27.2% | 21.9% |
| Sep. | 72,474,926 | 428,397,515 | 5.3% | 12.4% |
| Oct. | 67,489,658 | 405,411,867 | 19.3% | 22.2% |
| Nov. | 79,057,642 | 463,449,857 | 22.2% | 21% |
| Dec. | 79,735,562 | 466,322,342 | 17.2% | 8.8% |
| total | 811,160,378 | 4,726,758,102 | 13.5% | 19.1% |
From Jan. to Dec. 2013, the export amount of centrifuge is 47.27hundred million USD, with an increase of 19.1%.
From Jan. to Dec. 2013 China Centrifuge Major Export Countries/Regions Distribution
| No. | Country/Region | Quantity(-) | Amount(USD) | Year-on-Year | |
|
|
|
|
| Quantity | Amount |
| 1 | USA | 135,172,851 | 668,939,194 | -0.3% | 16% |
| 2 | Japan | 38,794,953 | 522,195,614 | -5.6% | 3.9% |
| 3 | India | 43,719,152 | 201,925,122 | -14.2% | -6.8% |
| 4 | Australia | 17,833,699 | 176,895,116 | 10.4% | 99.1% |
| 5 | Indonesia | 25,285,057 | 170,673,865 | 86.4% | 40.8% |
| 6 | Italy | 23,062,378 | 166,714,850 | 14.4% | 19.5% |
| 7 | Hong Kong | 8,063,813 | 166,665,005 | -16% | -17% |
| 8 | Viet Nam | 26,274,992 | 164,281,214 | 205.2% | 85.2% |
| 9 | Russia | 16,960,000 | 129,500,682 | -5% | 56% |
| 10 | Malaysia | 24,872,032 | 122,977,262 | 37.8% | 23.9% |
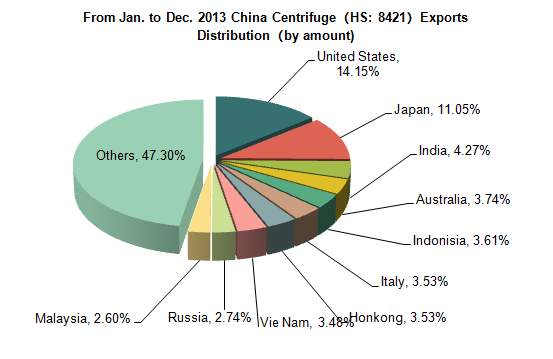
USA is the largest exporting market of Chinese centrifuge. From Jan. to Dec. 2013,our centrifuge exports amount to USA is 6.69 hundred million USD, with an increase of 16%, accounting for 14.51% of China's total exports amount. The second is Japan, accounting for 11.05% market share.
From Jan. to Dec. 2013, in the top ten exports destination Country / Region, the export volume to Viet Nam increased fastest by 205.2%. The export amount to Australia increased fastest by 99.1%.
From Jan. to Dec. 2013 China Centrifuge Original Places of Exported Goods
| No. | Region | Quantity(-) | Amount(USD) | Year-on-Year | |
|
|
|
|
| Quantity | Amount |
| 1 | Guangdong | 164,236,736 | 951,647,718 | 16.4% | 19.2% |
| 2 | Shanghai | 106,627,577 | 930,140,964 | 2.9% | 23.3% |
| 3 | Zhejiang | 288,320,002 | 742,808,716 | 17.3% | 24.3% |
| 4 | Jiangsu | 82,298,702 | 649,637,260 | 24.8% | 15.6% |
| 5 | Shandong | 30,926,566 | 276,535,839 | 11.4% | 15.1% |
| 6 | Beijing | 20,550,851 | 248,528,547 | 74.8% | 34.4% |
| 7 | Fujian | 20,135,928 | 150,550,650 | 15.3% | 32.7% |
| 8 | Sichuan | 13,809,955 | 133,892,377 | -50.6% | -9.2% |
| 9 | Anhui | 28,928,760 | 101,490,853 | 43.5% | 5.8% |
| 10 | Hebei | 20,908,859 | 90,958,984 | 34.1% | 23.3% |
Guangdong, Jiangsu, Zhejiang and Shanghai are the main original places of centrifuge. From Jan. to Dec. 2013, the vacuum pump export volume from these four provinces accounted for 79.08% of China's total export volume. The vacuum pump export amount from these four provinces accounted for 69.27% of China's total export amount.
From Jan. to Dec. 2013 China Valve and Similar Equipment(HS: 8481)Export Trend Analysis
From Jan. to Dec. 2013 China Valve and Similar Equipment Export Volume and Value
| Month | Quantity(-) | Amount(USD) | Year-on-Year | |
|
|
|
| Quantity | Amount |
| Jan. | 354,265,633 | 1,181,716,209 | 13.2% | 4% |
| Feb. | 259,499,548 | 891,176,861 | 62.1% | 54% |
| Mar. | 261,464,195 | 861,107,991 | -12.2% | -18.6% |
| Apr. | 324,116,752 | 1,104,506,745 | 3.2% | 0.3% |
| May | 370,526,665 | 1,233,434,871 | -0.4% | -2.7% |
| Jun. | 327,669,540 | 1,152,506,881 | 6.4% | -4.4% |
| Jul. | 378,467,007 | 1,212,988,841 | 24.1% | 6.8% |
| Aug. | 393,399,915 | 1,268,749,858 | 27.5% | 8.7% |
| Sep. | 366,703,574 | 1,213,361,835 | 12.3% | 3.1% |
| Oct. | 310,324,138 | 1,088,021,771 | 6.9% | 7.2% |
| Nov. | 372,530,508 | 1,266,663,763 | 22.5% | 20.6% |
| Dec. | 415,474,591 | 1,434,881,223 | 25.5% | 18.8% |
| total | 4,134,442,066 | 13,909,116,849 | 13.9% | 6.2% |
From Jan. to Dec. 2013, the export amount of valve and similar equipment is 139.09 hundred million USD, with an increase of 6.2%.
From Jan. to Dec. 2013 China Valve and Similar Equipment Major Export Countries/Regions Distribution
| No. | Country/Region | Quantity(-) | Amount(USD) | Year-on-Year | |
|
|
|
|
| Quantity | Amount |
| 1 | USA | 667,983,401 | 3,208,645,126 | 10.1% | 3.4% |
| 2 | Japan | 99,762,741 | 649,003,336 | 5% | -5.8% |
| 3 | Germany | 122,645,137 | 605,919,193 | 3.3% | 4.3% |
| 4 | Russia | 185,136,144 | 551,406,715 | 34.2% | 3.3% |
| 5 | England | 138,642,957 | 547,770,435 | 16.7% | 5.9% |
| 6 | Italy | 115,584,175 | 389,247,030 | 71.7% | -0.3% |
| 7 | Republic of Korea | 162,228,963 | 385,076,511 | 29.9% | 2.9% |
| 8 | Hong Kong | 74,053,281 | 364,218,974 | 35.7% | 31.8% |
| 9 | Canada | 39,192,935 | 308,376,422 | -6.3% | -11.6% |
| 10 | Australia | 47,140,287 | 291,206,449 | 11.1% | 10.1% |
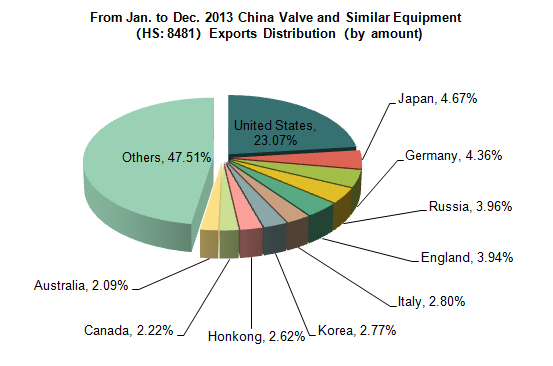
USA is the largest exporting market of Chinese valve and similar equipment. From Jan. to Dec. 2013,our valve and similar equipment exports amount to USA is 32.09 hundred million USD, with an increase of 3.4%, accounting for 23.07% of China's total exports amount. The second is Japan, accounting for 4.67% market share.
From Jan. to Dec. 2013 China Valve and Similar Equipment Original Places of Exported Goods
| No. | Region | Quantity(-) | Amount(USD) | Year-on-Year | |
|
|
|
|
| Quantity | Amount |
| 1 | Zhejiang | 1,926,183,676 | 5,042,776,473 | 8.7% | 6.2% |
| 2 | Guangdong | 323,463,411 | 2,124,302,874 | 23.8% | 10.1% |
| 3 | Jiangsu | 616,656,751 | 1,829,855,606 | 17.7% | -0.6% |
| 4 | Fujian | 406,555,848 | 1,356,055,335 | 6.1% | 17.5% |
| 5 | Shanghai | 239,297,217 | 943,400,612 | 6.6% | -1.5% |
| 6 | Shandong | 359,167,732 | 563,935,014 | 53.7% | -5.2% |
| 7 | Tianjin | 26,585,610 | 395,295,230 | 12.6% | 12.7% |
| 8 | Liaoning | 50,889,515 | 382,055,646 | -8.9% | -6.6% |
| 9 | Beijing | 11,552,186 | 306,713,203 | 17% | 11.7% |
| 10 | Hebei | 100,422,146 | 268,570,401 | 34.5% | 15.9% |
Zhejiang is the main original places of valve and similar equipment. From Jan. to Dec. 2013, the vacuum pump export volume from Zhejiang accounted for 46.59% of China's total export volume. The vacuum pump export amount from Zhejiang accounted for 36.26% of China's total export amount.
From Jan. to Dec. 2013 China Antifriction Bearing(HS: 8482)Export Trend Analysis
From Jan. to Dec. 2013 China Antifriction Bearing Export Volume and Value
| Month | Quantity(-) | Amount(USD) | Year-on-Year | |
|
|
|
| Quantity | Amount |
| Jan. | 428,861,524 | 373,387,236 | -3.6% | -5.6% |
| Feb. | 293,615,637 | 273,150,247 | 40.3% | 23.9% |
| Mar. | 329,905,551 | 346,144,799 | -18.1% | -7.8% |
| Apr. | 420,701,042 | 388,475,554 | 1.8% | 6.4% |
| May | 461,054,216 | 426,328,026 | 1.9% | 6.9% |
| Jun. | 420,959,684 | 366,820,207 | 3.7% | -0.2% |
| Jul. | 441,100,473 | 394,315,482 | 14.6% | 12.1% |
| Aug. | 441,793,807 | 399,093,927 | 11.6% | 11.8% |
| Sep. | 409,638,939 | 370,976,329 | 2.1% | 1.9% |
| Oct. | 391,008,980 | 330,100,312 | 12.8% | 5.6% |
| Nov. | 460,827,844 | 390,531,172 | 22.8% | 16.5% |
| Dec. | 496,182,646 | 415,909,670 | 24.4% | 13.6% |
| Jan.- Dec. total | 4,995,650,343 | 4,475,232,961 | 7.9% | 6.3% |
From Jan. to Dec. 2013, the export amount of antifriction bearing is 44.75 hundred million USD, with an increase of 6.3%.
From Jan. to Dec.2013 China Antifriction Bearing Major Export Countries/Regions Distribution
| No. | Country | Quantity(-) | Amount(USD) | Year-on-Year | |
|
|
|
|
| Quantity | Amount |
| 1 | USA | 595,909,544 | 666,820,858 | 7.8% | 5.8% |
| 2 | India | 504,489,459 | 331,630,484 | 10.4% | 4.6% |
| 3 | Republic of Korea | 320,916,660 | 274,982,256 | 5.5% | 2.1% |
| 4 | Germany | 365,146,902 | 273,015,534 | 10.7% | 4.3% |
| 5 | Japan | 315,107,870 | 266,417,492 | -1.8% | -3.6% |
| 6 | Italy | 186,141,713 | 217,107,963 | 13.3% | 17.5% |
| 7 | Viet Nam | 157,825,780 | 188,625,040 | 17.2% | 56.1% |
| 8 | Brazil | 267,836,291 | 181,172,357 | 23.6% | 18.6% |
| 9 | France | 83,110,769 | 144,886,720 | 24.3% | 7.9% |
| 10 | Malaysia | 107,366,298 | 140,789,878 | 3% | 7% |
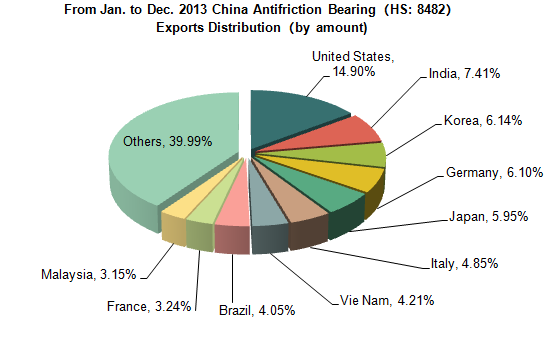
USA is the largest exporting market of Chinese antifriction bearing. From Jan. to Dec. 2013,our antifriction bearing exports amount to USA is 6.67 hundred million USD, with an increase of 5.8%, accounting for 14.9% of China's total exports amount. The second is India, accounting for 7.41% market share.
From Jan. to Dec. 2013 China Antifriction Bearing Original Places of Exported Goods
| No. | Region | Quantity(-) | Amount(USD) | Year-on-Year | |
|
|
|
|
| Quantity | Amount |
| 1 | Zhejiang | 2,529,110,618 | 1,486,128,545 | 9.5% | 7.2% |
| 2 | Jiangsu | 823,397,203 | 911,112,317 | 7% | 1.9% |
| 3 | Shanghai | 831,941,253 | 567,169,234 | -0.8% | -2% |
| 4 | Guangdong | 177,738,479 | 377,969,162 | 39.5% | 56.1% |
| 5 | Shandong | 274,974,108 | 371,511,736 | 39.5% | 7.7% |
| 6 | Liaoning | 47,502,610 | 220,032,309 | -15.3% | -3.8% |
| 7 | Hebei | 80,575,113 | 76,267,459 | 10.4% | 3.5% |
| 8 | Xinjiang | 8,216,455 | 58,910,229 | -0.2% | 26.6% |
| 9 | Fujian | 49,840,182 | 54,058,950 | -9.2% | -18.7% |
| 10 | Sichuan | 13,092,827 | 51,348,607 | -20.7% | 10.5% |
Zhejiang is the main original places of antifriction bearing. From Jan. to Dec. 2013, the antifriction bearing export volume from Zhejiang accounted for 50.63% of China's total export volume. The antifriction bearing export amount from Zhejiang accounted for 33.21% of China's total export amount.
Source: China Customs


