China Petroleum Oils Export Volume and Value, from Jan. to Dec. 2013
| Month | Volume (Kg) | Value (USD) | Year-on-Year | |
| Volume | Value | |||
| Jan. | 277,827,097 | 242,299,402 | -10.9% | -13.3% |
| Feb. | 93,350,833 | 81,552,343 | -78.2% | -77.9% |
| Mar. | 271,307,983 | 256,464,898 | 32.2% | 26.8% |
| Apr. | 83,720,607 | 80,705,193 | 67.4% | 32.3% |
| May | 106,040,214 | 85,943,602 | -40.1% | -52.4% |
| Jun. | 33,766,679 | 28,215,437 | -68.2% | -74.9% |
| Jul. | 172,694,732 | 146,051,541 | -18% | -22.4% |
| Aug. | 213,793,307 | 185,899,595 | 12.8% | 16.6% |
| Sept. | 67,999,798 | 69,195,759 | -66.7% | -60.7% |
| Oct. | 107,307,824 | 96,814,368 | -69.1% | -68.7% |
| Nov. | 97,296,361 | 88,315,258 | -19.2% | -19.9% |
| Dec. | 92,222,837 | 94,751,115 | 10.5% | 19.7% |
| Total | 1,617,328,272 | 1,456,208,511 | -33.6% | -34.6% |
The export volume of Chinese petroleum oils was 1.6173 million tons, from Jan. to Dec. 2013, declined 33.6% year on year; the export value was 1.456 billion dollars, declined 34.6% year on year.
China Petroleum Oils Major Export Countries/Regions Distribution, from Jan. to Dec. 2013
| No. | Countries/ Regions | Volume (Kg) | Value (USD) | Year-on-Year | |
| Volume | Value | ||||
| 1 | North Korea | 578,001,810 | 598,133,947 | 10.5% | 3.5% |
| 2 | Japan | 646,406,352 | 561,358,052 | -51.6% | -52% |
| 3 | USA | 199,260,656 | 149,176,106 | 0 | -13.7% |
| 4 | Malaysia | 193,659,413 | 147,540,326 | 5.2% | 2.5% |
| 5 | Singapore | 41 | 80 | -100% | -100% |
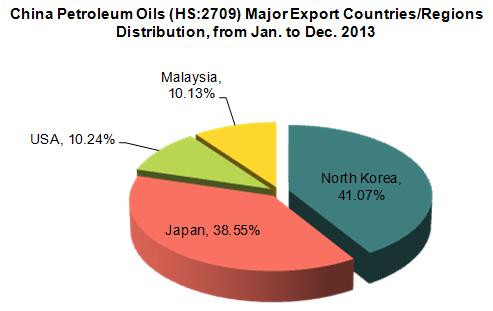
The largest export market for Chinese petroleum oils is North Korea. The total export value to North Korea was 598 million dollars, from Jan. to Dec. 2013, with an increase of 3.5% year on year. Among the total export value of petroleum oils, it accounted for 41.07%, followed by Japan, which accounted for 38.55%.
The exports of petroleum oils to Singapore were very small both in volume and value, and only 80 dollars in 2013.
China Petroleum Oils Original Places of Exported Goods, from Jan. to Dec. 2013
| No. | Regions | Volume (Kg) | Value (USD) | Year-on-Year | ||
| Volume | Value | |||||
| 1 | Zhejiang | 695,551,130 | 598,404,649 | -38% | -39.5% | |
| 2 | Heilongjiang | 578,001,810 | 598,133,947 | 10.5% | 3.5% | |
| 3 | Guangdong | 210,065,963 | 164,351,857 | 58.2% | 46.3% | |
| 4 | Tianjin | 73,810,370 | 50,075,074 | -66.5% | -69.5% | |
| 5 | Shandong | 38,967,579 | 31,861,104 | -78% | -79.3% | |
| 6 | Liaoning | 20,931,379 | 13,381,800 | -83.2% | -86.7% | |
| 7 | Beijing | 41 | 80 | 583.3% | 900% | |
The major petroleum oils original places in China are Zhejiang, Heilongjiang,and Guangdong. From Jan. to Dec. 2013, the export volume of the above three provinces accounted for 91.73% of the total export volume, and the export value of the three provinces accounted for 93.45% of the total export value.


