HS Code Corresponding to the Product name Instructions
| HS Code | Product name | Abbreviation |
| 8609 | Container (Including container transport liquids), Specially Designed Equip, Used For All Modes Of Transport | Container |
| 8701 | Tractor (Except The Tractor Of Heading 8702) | Tractor |
| 8702 | Passenger Motor Vehicles, >=10 Seats (Including Cab) | Bus with 10 Seats More |
| 8703 | Motor Vehicle Mainly Used For Manned (Except the Vehicle of heading 8702), Including Station Wagons and Racing Cars | Manned Vehicles, Including Racing Cars |
| 8704 | Freight Motor Vehicles | Freight Motor Vehicles |
| 8706 | Motor Vehicle Chassis Fitted With Engines, Using By the Vehicle Of Heading 8701-8705 | Bus, Trucks and Tractor Chassis Fitted With Engines |
| 8707 | Motor Vehicle Body(Including Cab),Using By the Vehicle Of Heading 8701-8705 | Bus, Trucks and Tractor Body |
| 8708 | Motor Vehicles Parts and Accessories, Using By The Vehicle Of Heading 8701-8705 | Bus, Trucks and Tractor Parts and Accessories |
| 8709 | Motor Vehicles Transport Goods In Short Distance, Fitted With Lifting Or Handling Equipment, Used In Factories, Warehouses, Dock Or Airport; Tractor Used In Train Station Platform; Parts Of The Above Vehicles. | Motor Vehicles Transport Goods in Short Distance |
| 8716 | Trailer and Semi Trailer Or Other Non-Mechanical Drive Vehicles and Their Parts and Accessories | Trailer and Semi Trailer |
January-December 2013 China Major Transportation Export Situation
| Product Name | Unit | Volume | Value(USD) | Year-on-Year | |
| Volume | Value | ||||
| Bus, Truck and Tractor Parts and Accessories | - | 5,450,061,919 | 25,527,855,468 | 8.20% | 12.70% |
| Container | Piece | 2,698,546 | 7,884,869,233 | 8.90% | -6.50% |
| Manned Vehicles, Including Racing Cars | Unit | 1,103,310 | 4,637,374,699 | -1% | -2.80% |
| Freight Motor Vehicles | Unit | 289,988 | 4,024,966,827 | -12.30% | -14.70% |
| Trailer and Semi-Trailer | - | 668,900,783 | 3,150,613,563 | 10.40% | 8% |
| Bus with 10 Seats More | Unit | 63,089 | 2,142,062,541 | 15.70% | 10.50% |
| Tractor | Unit | 166,462 | 1,321,032,412 | 11.90% | -11.20% |
| Bus, Trucks and Tractor Body | Set | 100,262 | 162,531,814 | 12.90% | 27.90% |
| Passenger Bus, Trucks and Tractor Chassis Fitted With Engines | Set | 4,122 | 83,461,687 | 179.30% | 99.70% |
| Motor Vehicles Transport Goods in Short Distance | - | 3,090,495 | 53,357,229 | 165.60% | 41% |
January-December 2013 China Container (HS: 8609) Export Enterprise Distribution
| No. | Region | Accumulated from January to December | Year-on-Year | ||
| Volume(Piece) | Value(USD) | Volume | Value | ||
| 1 | Guangdong | 577,970 | 2,001,833,424 | 15% | -4.10% |
| 2 | Jiangsu | 395,185 | 1,740,175,395 | 23.70% | 13.70% |
| 3 | Shanghai | 215,825 | 1,291,170,993 | -9.20% | -9.20% |
| 4 | Shandong | 179,458 | 1,284,849,915 | -20.20% | -20.10% |
| 5 | Zhejiang | 202,352 | 676,763,898 | 6.30% | 1.50% |
| 6 | Tianjin | 321,065 | 386,282,886 | -34.80% | -28.50% |
| 7 | Liaoning | 735,725 | 320,596,576 | 71.50% | -4.30% |
| 8 | Fujian | 60,866 | 175,009,723 | -16.70% | -22.80% |
| 9 | Jiangxi | 166 | 4,741,801 | 4.40% | 8.10% |
| 10 | Hebei | 9,438 | 1,232,274 | 29.30% | 27.90% |
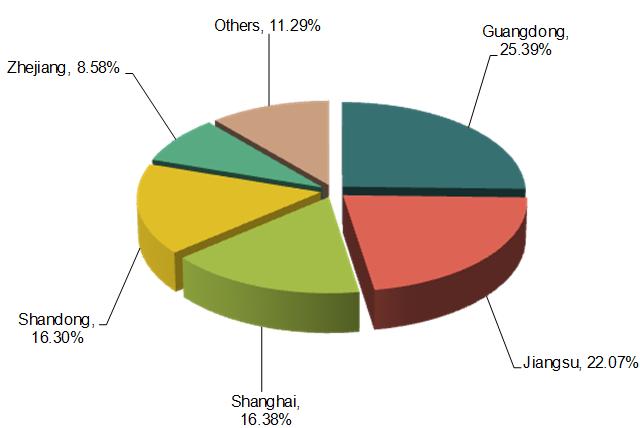
Judging from the statistics of Jan. to Dec. 2013,Guangdong, Jiangsu and Shanghai were the main sources of container,the export value of Guangdong and Jiangsu respectively accounted for 25.39% and 22.07% of China total export value.
January-December 2013 China Tractor (HS: 8701) Export Enterprise Distribution
| No. | Region | Accumulated from January to December | Year-on-Year | ||
| Volume(Unit) | Value(USD) | Volume | Value | ||
| 1 | Shandong | 62,831 | 531,684,970 | 26.20% | -7.80% |
| 2 | Henan | 6,425 | 120,884,620 | 70% | 128.30% |
| 3 | Jiangsu | 34,718 | 103,664,248 | 4.30% | -13% |
| 4 | Anhui | 2,595 | 85,381,662 | 107.10% | 80.10% |
| 5 | Beijing | 2,039 | 79,535,239 | -25.70% | 1.90% |
| 6 | Shanxi | 1,446 | 61,534,769 | -32.60% | -30.50% |
| 7 | Hubei | 1,515 | 57,841,844 | -71.10% | -74.60% |
| 8 | Inner Mongolia | 1,588 | 50,952,694 | -21.40% | -14.50% |
| 9 | Zhejiang | 36,785 | 48,902,708 | 2.80% | -7.20% |
| 10 | Chongqing | 1,205 | 35,183,571 | 113.70% | 49.50% |
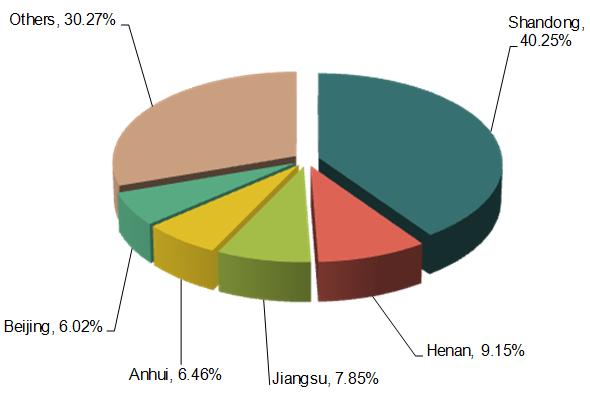
Judging from the statistics of Jan. to Dec. 2013, Shandong, Henan and Jiangsu were the main sources of tractor,the export value of Shandong accounted for 25.00 % more of the total.
January-December 2013 China Bus with 10 Seats More (HS: 8702) Export Enterprise Distribution
| No. | Region | Accumulated from January to December | Year-on-Year | ||
| Volume(Unit) | Value(USD) | Volume | Value | ||
| 1 | Henan | 5,411 | 462,043,468 | 5.80% | -2.40% |
| 2 | Fujian | 15,165 | 402,398,657 | 9.80% | 9.70% |
| 3 | Jiangsu | 7,978 | 340,840,391 | 6% | -8.20% |
| 4 | Shandong | 7,080 | 179,212,867 | 184.80% | 132.50% |
| 5 | Guangdong | 874 | 164,402,085 | 106.60% | 144.30% |
| 6 | Anhui | 3,709 | 129,250,390 | -35.80% | -33.10% |
| 7 | Liaoning | 9,193 | 103,222,445 | 22.10% | 28.20% |
| 8 | Shanghai | 1,273 | 84,071,270 | 9.60% | -10% |
| 9 | Hebei | 4,655 | 67,397,898 | 98.40% | 204.10% |
| 10 | Jiangxi | 2,542 | 61,658,163 | 215% | 125.30% |
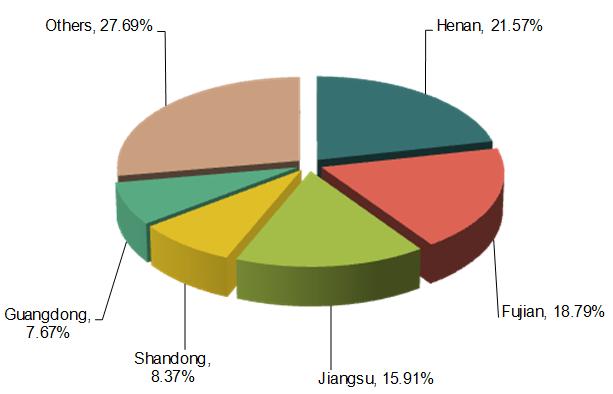
Judging from the statistics of Jan. to Dec. 2013,Henan, Fujian and Jiangsu were the main sources of bus with 10 seats more. In 2013, the export volume of Henan accounted for 21.57% of the total. Among the top ten bus with 10 seats more export provinces in 2013, the export values from Shandong, Guangdong, Hebei and Jiangxi increased the most, 132.5%,144.3%,204.1% and 125.3%, rapid growth.
January-December 2013 China Manned Vehicles, Including Racing Cars (HS: 8703) Export Enterprise Distribution
| No. | Region | Accumulated from January to December | Year-on-Year | ||
| Volume(Unit) | Value(USD) | Volume | Value | ||
| 1 | Zhejiang | 525,295 | 1,032,166,936 | 4.20% | 11.80% |
| 2 | Anhui | 144,658 | 933,363,258 | -29.60% | -26.90% |
| 3 | Chongqing | 126,790 | 557,363,571 | 16.60% | 29.90% |
| 4 | Shandong | 94,557 | 554,863,540 | 29.90% | 26.60% |
| 5 | Guangdong | 39,828 | 490,474,937 | -10.80% | -6.30% |
| 6 | Hebei | 26,284 | 247,009,671 | -26.10% | -22% |
| 7 | Shanghai | 15,928 | 108,120,833 | -7.90% | -17.50% |
| 8 | Jiangsu | 52,595 | 105,850,283 | 17.90% | 3.90% |
| 9 | Shanxi | 15,219 | 97,726,534 | -37.70% | -42.50% |
| 10 | Sichuan | 8,024 | 91,813,726 | 751.80% | 1733.60% |
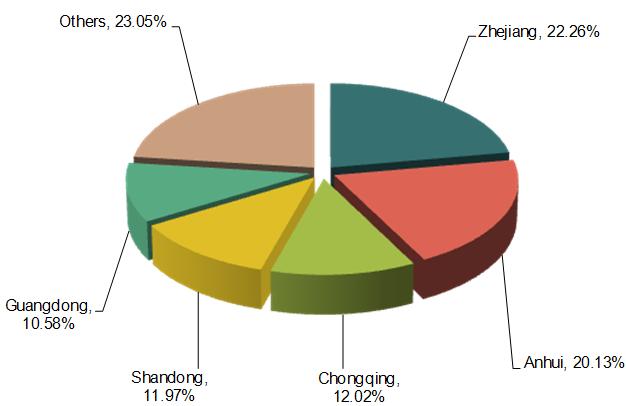
Judging from the statistics of Jan. to Dec. 2013, Zhejiang, Anhui and Chongqing were the main sources of manned vehicles, including racing cars. The export volume of Zhejiang and Anhui respectively accounted for 22.26% and 20.13% of the total. In 2013, the export values from Sichuan grew by 1733.6%.
January-December 2013 China Freight Motor Vehicles (HS: 8704) Export Enterprise Distribution
| No. | Region | Accumulated from January to December | Year-on-Year | ||
| Volume(Unit) | Value(USD) | Volume | Value | ||
| 1 | Shandong | 35,172 | 853,467,922 | -11% | -9.40% |
| 2 | Hubei | 47,067 | 378,268,754 | -9.40% | -5.90% |
| 3 | Hebei | 41,439 | 358,650,510 | -26.30% | -31.90% |
| 4 | Shanxi | 8,184 | 354,186,983 | -36.40% | -36.40% |
| 5 | Anhui | 31,116 | 346,162,352 | 4.50% | 4.60% |
| 6 | Beijing | 16,139 | 325,390,567 | 9.50% | 11.70% |
| 7 | Jiangxi | 14,731 | 161,524,283 | -7.90% | -0.20% |
| 8 | Inner Mongolia | 1,781 | 147,579,107 | -29.50% | -34.10% |
| 9 | Jiangsu | 7,974 | 143,199,743 | -16.40% | -11.10% |
| 10 | Henan | 11,444 | 127,539,742 | 39.30% | 12% |
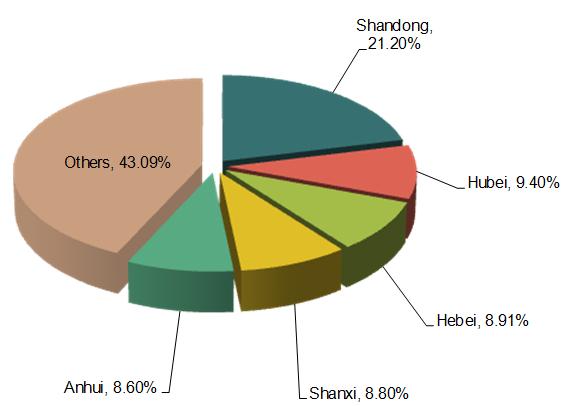
Judging from the statistics of Jan. to Dec. 2013, Shandong, Hubei and Hebei were the main sources of freight motor vehicles, the export value of Shandong accounted for 21.20% of the total.
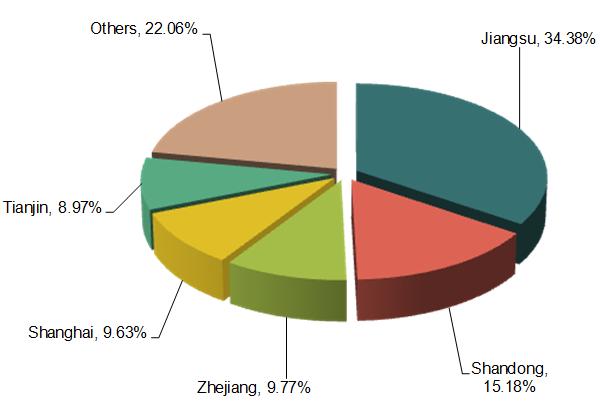
January-December 2013 China Passenger Bus, Trucks and Tractor Chassis Fitted With Engines (HS: 8706) Export Enterprise Distribution
| No. | Region | Accumulated from January to December | Year-on-Year | ||
| Volume(Set) | Value(USD) | Volume | Value | ||
| 1 | Jiangsu | 420 | 18,413,748 | 445.50% | 758.70% |
| 2 | Hebei | 1,644 | 11,068,794 | 1215.20% | 1186.50% |
| 3 | Shanxi | 186 | 8,795,827 | 8.80% | -38.60% |
| 4 | Anhui | 479 | 8,416,316 | 470.20% | 445.90% |
| 5 | Beijing | 162 | 7,840,887 | 7.30% | 149% |
| 6 | Henan | 382 | 7,460,144 | 115.80% | 221.60% |
| 7 | Hubei | 233 | 5,325,344 | 167.80% | 203.70% |
| 8 | Jilin | 180 | 4,005,400 | 23.30% | 36.90% |
| 9 | Guangxi | 120 | 3,354,985 | 0% | 0% |
| 10 | Shandong | 180 | 3,103,759 | -21.10% | -31.90% |
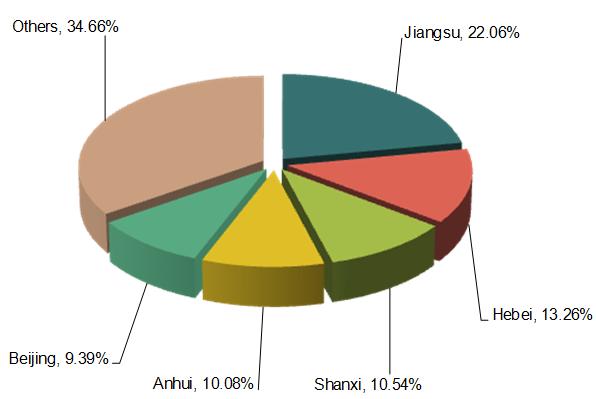
Judging from the statistics of Jan. to Dec. 2013, Jiangsu, Hebei and Shanxi were the main sources of passenger bus, trucks and tractor chassis fitted with engines, the export value of Jiangsu accounted for 22.06% of the total.
January-December 2013 China Bus, Trucks and Tractor Body (HS: 8707) Export Enterprise Distribution
| No. | Region | Accumulated from January to December | Year-on-Year | ||
| Volume(Set) | Value(USD) | Volume | Value | ||
| 1 | Zhejiang | 12,485 | 30,283,165 | 379.60% | 719.90% |
| 2 | Jiangsu | 31,037 | 29,334,922 | 74.50% | 70.90% |
| 3 | Shandong | 5,812 | 19,254,326 | -18.30% | -31.20% |
| 4 | Guangdong | 10,436 | 11,429,657 | 99.10% | -6.90% |
| 5 | Hubei | 2,671 | 10,313,490 | -71.90% | -69.10% |
| 6 | Shanghai | 1,534 | 10,243,351 | 80.90% | 42.60% |
| 7 | Chongqing | 17,122 | 9,466,663 | 68.70% | 60.10% |
| 8 | Liaoning | 7,644 | 7,866,243 | 1746.40% | 1018.90% |
| 9 | Sichuan | 1,375 | 7,108,281 | 4196.90% | 3707.50% |
| 10 | Beijing | 2,544 | 5,492,937 | -69.40% | -13% |
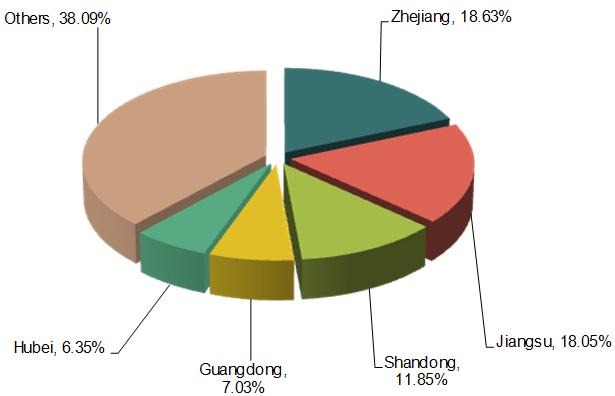
Judging from the statistics of Jan. to Dec. 2013, Zhejiang, Jiangsu and Shandong were the main sources of bus, trucks and tractor body, the export value of Zhejiang and Jiangsu respectively accounted for 18.63% and 18.05% of the total. In 2013, the export value of Zhejiang grew by 719.9%, got the first, meanwhile, Hubei fell by 69.1%, from the first dropped to the fifth place. Among the top ten buses, trucks and tractor export provinces, the export value of Liaoning and Sichuan respectively jumped up 1018.9% and 3707.5%
January-December 2013 China Bus, Trucks and Tractor Parts and Accessories (HS: 8708) Export Enterprise Distribution
| No. | Region | Accumulated from January to December | Year-on-Year | ||
| Volume(-) | Value(USD) | Volume | Value | ||
| 1 | Zhejiang | 1,135,146,937 | 5,278,807,550 | 8.50% | 9.60% |
| 2 | Jiangsu | 647,924,334 | 4,260,684,852 | 7.90% | 7.80% |
| 3 | Shanghai | 327,122,304 | 3,085,057,231 | -1.20% | 13% |
| 4 | Guangdong | 427,405,298 | 3,021,076,494 | 6% | 20.30% |
| 5 | Shandong | 1,338,100,590 | 2,953,713,424 | 12.90% | 15.50% |
| 6 | Hebei | 251,543,230 | 1,046,689,905 | -1.90% | 5% |
| 7 | Tianjin | 146,731,088 | 1,009,212,458 | 9.90% | 14% |
| 8 | Fujian | 281,837,802 | 839,733,556 | -1.60% | 6.20% |
| 9 | Beijing | 125,317,101 | 833,342,679 | 21.10% | 44.10% |
| 10 | Liaoning | 178,448,397 | 489,641,292 | 0.70% | -3.90% |
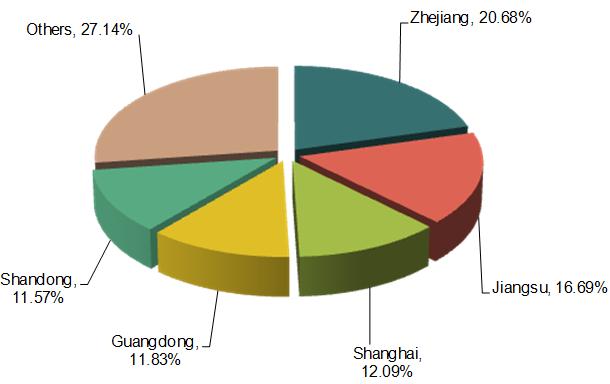
Judging from the statistics of Jan. to Dec. 2013, Zhejiang, Jiangsu and Shanghai were the main sources of bus, trucks and tractor parts and accessories, the export value of Zhejiang accounted for 20.68% of the total.
January-December 2013 China Motor Vehicles Transport Goods in Short Distance (HS: 8709) Export Enterprise Distribution
| No. | Region | Accumulated from January to December | Year-on-Year | ||
| Volume(-) | Value(USD) | Volume | Value | ||
| 1 | Jiangsu | 145,269 | 18,343,837 | -42.60% | 29.70% |
| 2 | Shandong | 106,757 | 8,100,413 | -20.50% | 130% |
| 3 | Zhejiang | 377,143 | 5,214,268 | 141.70% | 8.60% |
| 4 | Shanghai | 220,565 | 5,137,864 | 78.60% | 45.30% |
| 5 | Tianjin | 12,663 | 4,788,237 | 1109.50% | 1003.80% |
| 6 | Guangdong | 103,162 | 2,204,830 | -12.30% | 6% |
| 7 | Henan | 112,449 | 1,549,128 | 102.30% | 149.50% |
| 8 | Shanxi | 1,867,871 | 1,525,483 | 1428.20% | 860.20% |
| 9 | Xinjiang Uygur Autonomous Region | 40,675 | 1,412,587 | 12.70% | 230.50% |
| 10 | Hebei | 11,067 | 1,347,572 | -61.20% | -65.90% |
Judging from the statistics of Jan. to Dec. 2013, Jiangsu, Shandong and Zhejiang were the main sources of motor vehicles transport goods in short distance, the export value of Jiangsu accounted for 34.36% of the total. In 2013, the export value of Tianjin, Henan, Shanxi and Xinjiang increased the most, 1003.8%, 149.5%, 860.2% and 230.5% compared to that of 2012
January-December 2013 China Trailer and Semi Trailer (HS: 8716) Export Enterprise Distribution
| No. | Region | Accumulated from January to December | Than Last Year | ||
| Volume(-) | Value(USD) | Volume | Value | ||
| 1 | Shandong | 240,263,123 | 909,515,054 | 15.20% | 17.80% |
| 2 | Guangdong | 254,440,569 | 898,074,681 | 6.90% | 3.10% |
| 3 | Zhejiang | 62,693,122 | 438,163,170 | 15.70% | 15.10% |
| 4 | Jiangsu | 42,524,819 | 389,804,646 | 24.20% | 11.60% |
| 5 | Shanghai | 32,810,374 | 151,679,131 | -5.20% | -6.60% |
| 6 | Hebei | 5,156,381 | 49,607,962 | 7.40% | 61.80% |
| 7 | Hubei | 4,792,459 | 49,145,747 | 3.70% | 23.30% |
| 8 | Tianjin | 1,767,752 | 44,085,528 | 48.30% | 6.50% |
| 9 | Liaoning | 2,339,599 | 43,323,498 | 41.40% | 1.20% |
| 10 | Fujian | 8,526,158 | 42,102,089 | -20% | -36.60% |
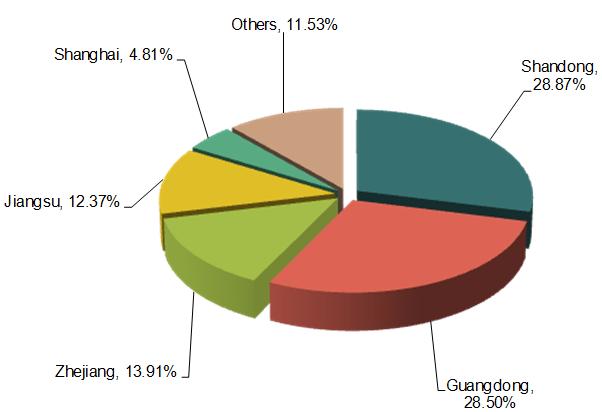
Judging from the statistics of Jan. to Dec. 2013, Shandong, Guangdong and Zhejiang were the main sources of trailer and semi trailer, the export value of Shandong and Guangdong respectively accounted for 28.87% and 28.5% of the total.
Source: China Customs
")


