January-December 2013 China Container (HS: 8609) Main Export Country/ Region
| No. | Country/ Region | Accumulated from January to December | Year-on-Year | ||
| Volume(Piece) | Value(USD) | Volume | Value | ||
| 1 | United States | 577,631 | 2,368,409,924 | -11.30% | -13.40% |
| 2 | Hong Kong | 469,623 | 1,544,218,012 | -1.10% | -7.10% |
| 3 | United Kingdom | 135,428 | 797,385,904 | 16.70% | 17.70% |
| 4 | Denmark | 117,562 | 549,642,428 | -54.50% | -56.40% |
| 5 | Singapore | 155,548 | 413,581,711 | 81.80% | 57.50% |
| 6 | Germany | 86,210 | 247,251,244 | -16.10% | -15.20% |
| 7 | Taiwan | 65,796 | 232,705,026 | 397.10% | 759.70% |
| 8 | Japan | 466,611 | 222,584,020 | 29.70% | 77.40% |
| 9 | Netherlands | 16,619 | 202,244,826 | -11.10% | 31% |
| 10 | Bermuda | 20,430 | 179,203,746 | 7.10% | -9.10% |
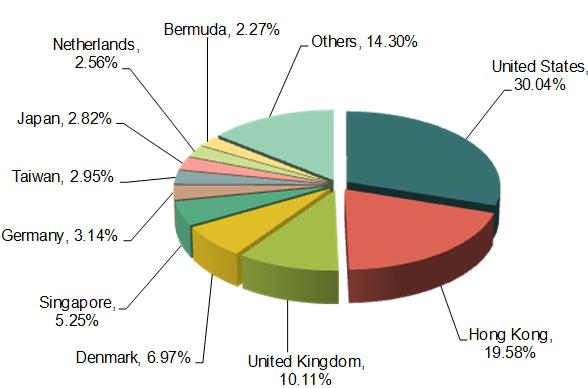
2013 China total container export volume was to 2.6985 million, an increase of 8.9%; export value amounted to 7.885 billion U.S. dollars, down 6.5%. January-December 2013,China container main export countries/regions were United States, Hong Kong, United Kingdom, Denmark, Singapore, Germany, Taiwan, Japan, Netherlands, Bermuda and etc.. United States is the main export market, and in 2013 the export value of the United States accounted for 30.04% of total export value of such products. Among the top ten export markets, the export value of Taiwan grew by 759.7%, the fastest growth, while in contrast with the general downward trend in export price, in 2013 our container export price for Taiwan was nearly double in 2012.
January-December 2013 China Tractor (HS: 8701) Main Export Country/ Region
| No. | Country/ Region | Accumulated from January to December | Year-on-Year | ||
| Volume(Unit) | Value(USD) | Volume | Value | ||
| 1 | Nigeria | 4,081 | 146,196,808 | 25.80% | 29.30% |
| 2 | Ethiopia | 3,976 | 94,596,587 | 56.80% | 100.50% |
| 3 | Algeria | 3,270 | 66,255,250 | -5.40% | 6.60% |
| 4 | Malaysia | 2,333 | 63,505,072 | 9.30% | 39.30% |
| 5 | Russian Federation | 10,498 | 55,873,438 | 5.50% | -30.60% |
| 6 | Thailand | 2,086 | 55,301,980 | -41.80% | -40.90% |
| 7 | Ukraine | 37,693 | 51,781,219 | 145.10% | 33.10% |
| 8 | Bangladesh | 36,714 | 44,576,242 | 3.10% | 3.10% |
| 9 | Venezuela | 979 | 44,560,422 | -17.60% | -21.40% |
| 10 | Tanzania | 1,458 | 36,672,015 | 17.70% | 73.90% |
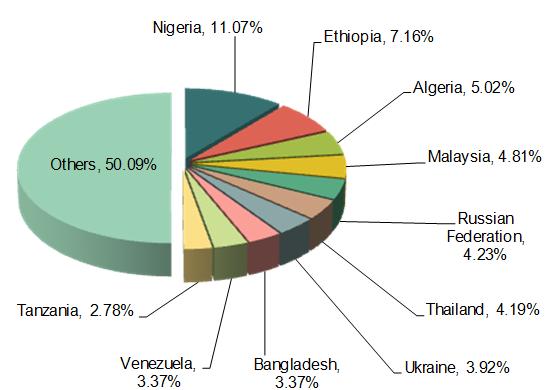
2013 China total tractor export volume was 166,500, an increase of 11.9%; export value amounted to 1.321 billion U.S. dollars, down 11.2%. January-December 2013,China tractor main export countries/regions were Nigeria, Ethiopia, Algeria, Malaysia, Russian Federation, Thailand, Ukraine, Bangladesh, Venezuela, Tanzania and etc.. Export markets were focus in less developed countries of Asia, Africa, and Latin America. Nigeria is the main export market, and in 2013 the export value of the Nigeria accounted for 11.07% of total export value of such products. Among the top ten export markets, the export value of Ethiopia grew by 100.5%, the fastest growth.
January-December 2013 China Bus with 10 Seats More (HS: 8702) Main Export Country/ Region
| No. | Country/ Region | Accumulated from January to December | Year-on-Year | ||
| Volume(Unit) | Value(USD) | Volume | Value | ||
| 1 | Saudi Arabia | 3,571 | 180,440,213 | -10.10% | -6.80% |
| 2 | Hong Kong | 659 | 144,970,074 | 36.70% | 90.30% |
| 3 | Chile | 4,945 | 117,043,468 | 19.10% | 35.70% |
| 4 | Peru | 4,186 | 96,113,018 | 0.20% | 27.80% |
| 5 | Kazakhstan | 1,462 | 85,691,235 | 119.20% | 160.80% |
| 6 | Thailand | 1,112 | 80,986,341 | 91.40% | 61.30% |
| 7 | Egypt | 9,160 | 67,420,357 | -24.70% | -32.40% |
| 8 | Russian Federation | 703 | 65,393,519 | -1.30% | 5.70% |
| 9 | Iraq | 5,726 | 63,422,712 | 335.80% | 184.40% |
| 10 | Australia | 489 | 59,939,617 | -22.10% | -19.70% |
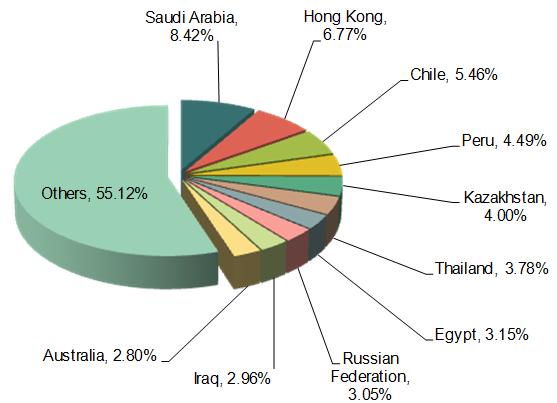
2013 China total bus with 10 seats more export volume was 631,000, an increase of 15.7%; export value amounted to 2.142 billion U.S. dollars, down 10.5%. January-December 2013,China bus with 10 seats more main export countries/regions were Saudi Arabia, Hong Kong, Chile, Peru, Kazakhstan, Thailand, Egypt, Russian Federation, Iraq, Australia and etc.. Saudi Arabia is the main export market, and in 2013 the export value of the Saudi Arabia accounted for 8.42% of total export value of such products. Among the top ten export markets, the export value of Kazakhstan and Iraq rose more than 100% year on year, respectively grew by 160.8% and 184.4%
January-December 2013 China Manned Vehicles, Including Racing Cars (HS: 8703) Main Export Country/ Region
| No. | Countries/Regions | Accumulated from January to December | Year-on-Year | ||
| Volume(Unit) | Value(USD) | Volume | Value | ||
| 1 | Russian Federation | 134,085 | 685,935,496 | 33.80% | 28.20% |
| 2 | Chile | 72,567 | 414,710,751 | 29.90% | 31.60% |
| 3 | Iran | 47,141 | 408,883,510 | -27.70% | -8.10% |
| 4 | Canada | 30,070 | 247,345,857 | 24.10% | 94.10% |
| 5 | Algeria | 44,898 | 245,985,810 | -27.50% | -25.60% |
| 6 | Ukraine | 41,666 | 171,317,297 | 19.30% | -8.80% |
| 7 | Colombia | 28,790 | 163,851,395 | 13% | 16% |
| 8 | Peru | 26,627 | 159,448,418 | 12.30% | 11.10% |
| 9 | Uruguay | 26,764 | 153,846,170 | 88.60% | 144.40% |
| 10 | United States | 147,065 | 153,464,985 | 4.30% | 2.90% |
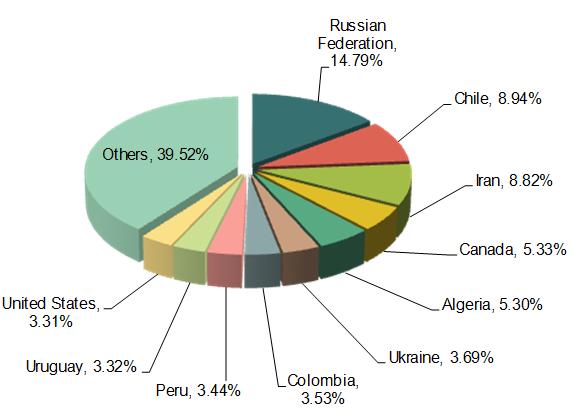
2013 China total manned vehicles, including racing cars export volume was 1,103,300, down 1%; export value amounted to 4.637 billion U.S. dollars, down 2.8%. January-December 2013,China manned vehicles, including racing cars main export countries/regions were Russian Federation, Chile, Iran, Canada, Algeria, Ukraine, Colombia, Peru, Uruguay, United States and etc.. Russian Federation is the main export market, and in 2013 the export value of the Russian Federation accounted for 14.79% of total export value of such products. Among the top ten export markets, the export value of Uruguay grew by 144.4%, the fastest growth.
January-December 2013 China Freight Motor Vehicles (HS: 8704) Main Export Country/ Region
| No. | Countries/Regions | Accumulated from January to December | Year-on-Year | ||
| Volume(Unit) | Value(USD) | Volume | Value | ||
| 1 | Algeria | 69,246 | 453,600,657 | -19.80% | -12.10% |
| 2 | Kazakhstan | 7,650 | 223,378,937 | -28.60% | -30.90% |
| 3 | Viet Nam | 13,973 | 217,900,894 | 12% | 13.80% |
| 4 | Myanmar | 15,353 | 201,899,005 | 79.10% | 9.30% |
| 5 | Russian Federation | 4,330 | 152,757,433 | -70.30% | -71.30% |
| 6 | Chile | 14,922 | 146,521,937 | 27.80% | 26.20% |
| 7 | Peru | 10,713 | 145,901,525 | -1.20% | -5.40% |
| 8 | North Korea | 6,380 | 143,282,462 | -5.90% | 1.50% |
| 9 | Philippines | 4,689 | 112,811,272 | 0.40% | 23.50% |
| 10 | Venezuela | 9,742 | 109,471,325 | 20.80% | -9.60% |
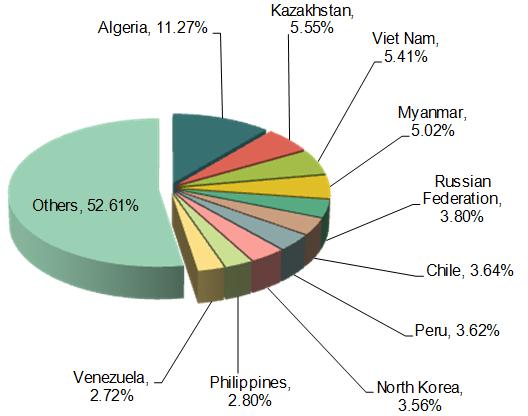
2013 China total freight motor vehicles export volume was 290,000, down 12.3%; export value amounted to 4.025 billion U.S. dollars, down 14.7%. January-December 2013,China freight motor vehicles main export countries/regions were Algeria, Kazakhstan, Viet Nam, Myanmar, Russian Federation, Chile, Peru, North Korea, Philippines, Venezuela and etc.. Algeria is the main export market, and in 2013 the export value of Algeria accounted for 11.27% of total export value of such products.
January-December 2013 China Bus, Trucks and Tractor Chassis Fitted With Engines (HS: 8706) Main Export Country/ Region
| No. | Countries/Regions | Accumulated from January to December | Year-on-Year | ||
| Volume(Set) | Value(USD) | Volume | Value | ||
| 1 | Indonesia | 223 | 11,545,516 | 52.70% | 75.10% |
| 2 | Ecuador | 1,621 | 10,929,268 | 1250.80% | 1182.20% |
| 3 | Venezuela | 213 | 9,751,050 | 0% | 0% |
| 4 | Viet Nam | 380 | 9,014,520 | 53.80% | 96.30% |
| 5 | Djibouti | 114 | 5,554,325 | 660% | 725.60% |
| 6 | Algeria | 59 | 4,566,583 | 0% | 0% |
| 7 | Malaysia | 120 | 4,098,862 | -14.30% | -10.20% |
| 8 | Egypt | 307 | 3,609,554 | 332.40% | 239.60% |
| 9 | Russian Federation | 110 | 3,142,029 | 64.20% | 210.30% |
| 10 | Ukraine | 102 | 2,338,864 | 41.70% | 37.60% |
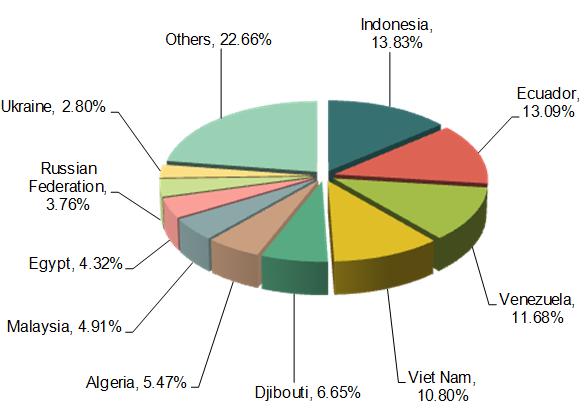
2013 China total passenger bus, trucks and tractor chassis fitted with engines export volume was 4122, an increase of 179.3%; export value amounted to 83 million U.S. dollars, grew by 99.7%. January-December 2013, China passenger bus, trucks and tractor chassis fitted with engines main export countries/regions were Asia, Africa, Latin America, such as Indonesia, Ecuador, Venezuela, Viet Nam, Djibouti, Algeria, Malaysia, Egypt, Russian Federation, and in 2013 the export value of Indonesia, Ecuador and Venezuela respectively accounted for 13.83%,13.09% and 11.68% of total export value of such products. The export value of Ecuador, Djibouti, Egypt and Russian Federation respectively grew by 1182.2%, 725.6%, 239.6% and 210.3%, the fastest growth.
January-December 2013 China Bus, Trucks and Tractor Body (HS: 8707) Main Export Country/ Region
| No. | Countries/Regions | Accumulated from January to December | Year-on-Year | ||
| Volume(Set) | Value(USD) | Volume | Value | ||
| 1 | Ukraine | 9,814 | 38,830,952 | 12985.30% | 15189.10% |
| 2 | Myanmar | 29,723 | 19,582,987 | 164% | 141.70% |
| 3 | India | 9,884 | 10,236,069 | 2.80% | -59.20% |
| 4 | Russian Federation | 3,258 | 7,344,873 | -34.30% | 7.80% |
| 5 | Venezuela | 7,329 | 7,162,355 | 5625.80% | 4171.60% |
| 6 | Hong Kong | 857 | 6,806,184 | 36.70% | 101.20% |
| 7 | Malaysia | 1,233 | 6,641,593 | -53.90% | -62.80% |
| 8 | United Kingdom | 1,134 | 6,030,505 | 100.40% | 57.90% |
| 9 | Australia | 400 | 5,150,971 | -1.70% | 34.90% |
| 10 | Iran | 734 | 4,712,710 | -86.50% | -77.40% |
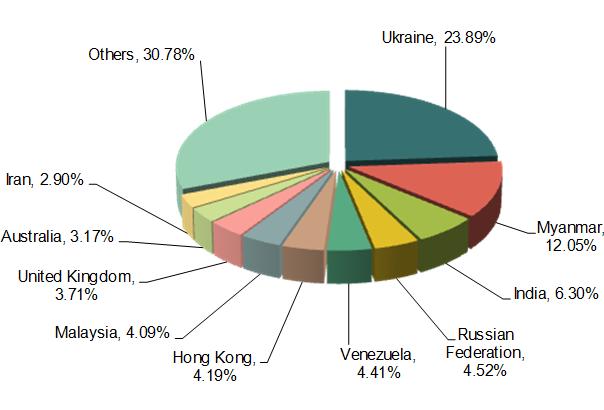
2013 China total bus, trucks and tractor body export volume was 100,300, an increase of 12.9%; export value amounted to 163 million U.S. dollars, increased by 27.9%. January-December 2013,China bus, trucks and tractor body main export countries/regions were Ukraine, Myanmar, India, Russian Federation, Venezuela, Hong Kong, Malaysia, United Kingdom, Australia, Iran and etc.. Ukraine is the main export market, and in 2013 the export value of the Ukraine accounted for 23.89% of total export value of such products. The export value of the top ten export markets turned larger changes, the export value of Ukraine and Venezuela grew by 15189.1% and 4171.6%, of Myanmar and Hong Kong increased 141.7% and 101.2%; but the export to India, Malaysia and Iran dropped significantly, export value year on year decline to 59.2%, 62.8% and 77.4%.
January-December 2013 China Bus, Trucks and Tractor Parts and Accessories (HS: 8708) Main Export Country/ Region
| No. | Countries/Regions | Accumulated from January to December | Year-on-Year | ||
| Volume(-) | Value(USD) | Volume | Value | ||
| 1 | United States | 1,856,434,831 | 7,768,329,270 | 9.10% | 11.50% |
| 2 | Japan | 354,173,472 | 2,575,175,148 | 7.50% | 9.30% |
| 3 | Republic of Korea | 167,295,014 | 1,207,488,639 | 2.90% | 17% |
| 4 | Germany | 210,968,128 | 1,101,947,544 | 10.30% | 19.50% |
| 5 | Russian Federation | 206,349,475 | 986,436,339 | 2.80% | 4.30% |
| 6 | Mexico | 135,594,844 | 784,002,242 | 10.40% | 17.30% |
| 7 | Thailand | 119,320,300 | 738,771,790 | 8.90% | 23.80% |
| 8 | Canada | 191,614,125 | 662,424,389 | 8.10% | 7.90% |
| 9 | United Kingdom | 168,456,306 | 636,811,484 | 15.50% | 12.80% |
| 10 | Malaysia | 111,684,465 | 599,779,521 | 9.10% | 7.60% |
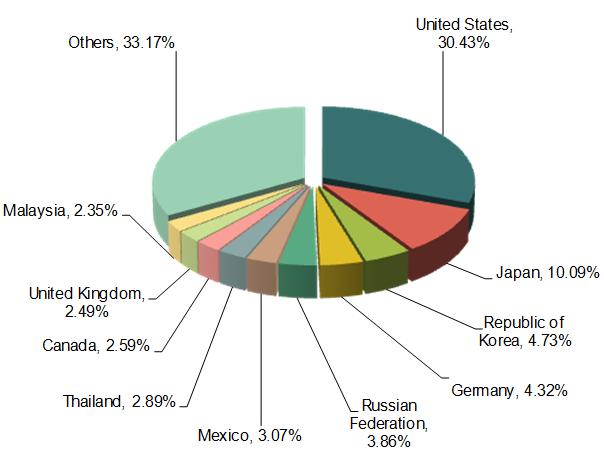
2013 China total bus, trucks and tractor parts and accessories export volume was 5.45 billion, an increase of 8.2%; export value amounted to 25.528 billion U.S. dollars, down 12.7%. January-December 2013,China bus, trucks and tractor parts and accessories main export countries/regions were United States, Japan, Republic of Korea, Germany, Russian Federation, Mexico, Thailand, Canada, United Kingdom, Malaysia and etc.. United States is the main export market, and in 2013 the export value of the United States accounted for 30.43% of total export value of such products.
January-December 2013 China Motor Vehicles Transport Goods in Short Distance (HS: 8709) Main Export Country/ Region
| No. | Countries/Regions | Accumulated from January to December | Year-on-Year | ||
| Volume(-) | Value(USD) | Volume | Value | ||
| 1 | Malaysia | 128,947 | 3,784,975 | 379.60% | 541.90% |
| 2 | United States | 548,114 | 3,766,998 | 36.50% | 6.90% |
| 3 | Saudi Arabia | 7,903 | 3,130,011 | 45% | 838.20% |
| 4 | Hong Kong | 10,959 | 3,076,744 | -38% | 92% |
| 5 | India | 26,479 | 2,978,053 | 27.20% | 577.50% |
| 6 | Republic of Korea | 48,032 | 2,841,073 | 12.50% | -16.90% |
| 7 | Ethiopia | 4,475 | 2,668,094 | 347.90% | 2956.30% |
| 8 | Brazil | 1,565 | 2,627,087 | -83.30% | 54.70% |
| 9 | Japan | 1,875,361 | 2,502,261 | 1358.50% | 12.20% |
| 10 | Indonesia | 6,639 | 2,331,211 | 306.80% | 144.20% |
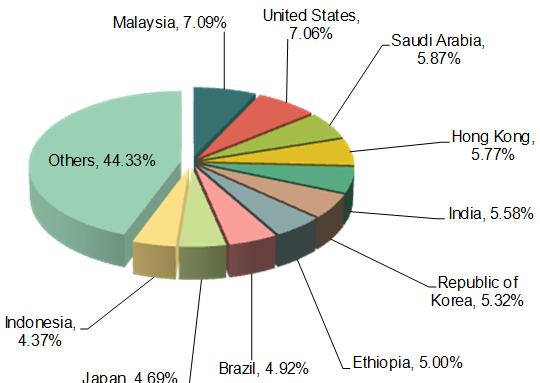
2013 China total motor vehicles transport goods in short distance export volume was 3.0905 million, an increase of 165.6%; export value amounted to 53 million U.S. dollars, grew by 41%. January-December 2013,China motor vehicles transport goods in short distance main export countries/regions were Malaysia, United States, Saudi Arabia, Hong Kong, India, Republic of Korea, Ethiopia, Brazil, Japan, Indonesia and etc.. Malaysia and United States are the main export markets, and in 2013 the export value of the Malaysia and United States accounted for 7.09% and 7.06% of total export value of such products.
January-December 2013 China Trailer and Semi Trailer (HS: 8716) Main Export Country/ Region
| No. | Countries/Regions | Accumulated from January to December | Year-on-Year | ||
| Volume(-) | Value(USD) | Volume | Value | ||
| 1 | United States | 169,014,429 | 767,245,857 | 6.70% | 5.90% |
| 2 | Australia | 30,154,675 | 206,077,184 | 1.60% | 7.70% |
| 3 | Japan | 22,210,687 | 181,497,538 | 19.70% | 3.50% |
| 4 | Germany | 37,312,692 | 134,105,012 | 3.90% | 1.90% |
| 5 | United Kingdom | 26,287,093 | 103,408,716 | 8.60% | -4.90% |
| 6 | Netherlands | 25,908,552 | 102,015,632 | 30% | 14.70% |
| 7 | Russian Federation | 22,237,383 | 96,173,280 | 2.20% | 3.80% |
| 8 | Nigeria | 10,394,610 | 78,284,642 | 24% | 46.80% |
| 9 | Malaysia | 19,580,459 | 73,391,484 | 25% | 36.10% |
| 10 | Thailand | 28,699,053 | 72,952,602 | 38% | 25.80% |
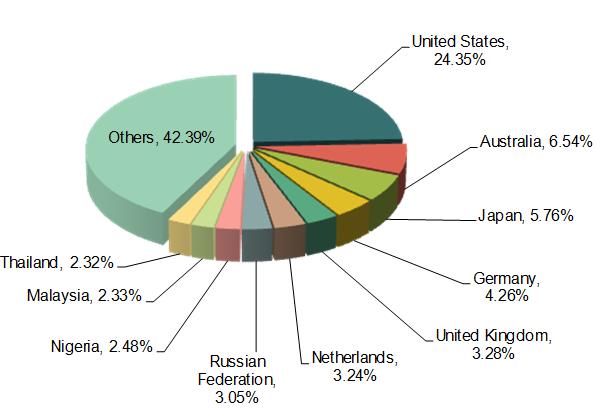
2013 China total trailer and semi trailer export volume was 0.669 billion, an increase of 10.4%; export value amounted to 3.151 billion U.S. dollars, grew by 8%. January-December 2013, China trailer and semi trailer main export countries/regions were United States, Australia, Japan, Germany, United Kingdom Netherlands, Russian Federation, Nigeria, Malaysia, Thailand and etc... United States is the main export market, and in 2013 the export value of the United States accounted for 24.35% of total export value of such products.
Source: China Customs


