China Glazed Ceramic Tile Export Analysis, from January to May, 2014
Export Amount and Value of China Glazed Ceramic Tile, from January to May, 2014
| Month | Quantity(KG) | Value(US dollars) | Compared to the same period last year | |
| Quantity | Value | |||
| January | 993,481,110 | 520,891,618 | 6.2% | 22.7% |
| February | 324,118,510 | 145,107,753 | -29.1% | -40.2% |
| March | 673,125,476 | 263,586,724 | -1.1% | -3.5% |
| April | 811,606,972 | 286,507,677 | 1.5% | -24.5% |
| May | 875,821,358 | 335,020,775 | -3.9% | -22.7% |
| Total | 3,678,153,426 | 1,551,114,547 | -2.8% | -11.6% |
From January to May 2014, China Glazed Ceramic Tiles exporting amounted to 3,678,200 tons, having an decrease of 2.8% compared to the same period last year; and it valued 1.55 billion US dollars, having a decrease of 11.6% compared to the same period last year.
Major Export Countries/ Regions Distribution of China Glazed Ceramic Tile, from January to May, 2014
| No. | Country/ Region | Amount(KG) | Value(US dollars) | Compared to the same period last year | |
| Amount | Value | ||||
| 1 | Malaysia | 83,469,180 | 112,515,551 | 6.4% | -14.1% |
| 2 | United States | 297,722,619 | 100,258,978 | -2.5% | -3.6% |
| 3 | Hong Kong | 70,114,257 | 75,332,445 | 10.7% | -12% |
| 4 | Nigeria | 278,456,785 | 64,434,816 | 15.9% | 32% |
| 5 | United Arab Emirates | 139,245,775 | 59,955,682 | -18.5% | -13.9% |
| 6 | Korea | 216,623,112 | 57,094,344 | 31.8% | 27.9% |
| 7 | Indonesia | 53,400,769 | 55,812,318 | 97.9% | 42.7% |
| 8 | Singapore | 66,539,628 | 50,590,344 | -35.6% | -25.4% |
| 9 | Tanzania | 63,093,224 | 47,290,929 | 30% | 329% |
| 10 | Saudi Arabia | 144,797,391 | 46,834,001 | -65.8% | -62.6% |
| 11 | Philippines | 161,619,600 | 44,576,316 | 19.3% | 16.4% |
| 12 | Iran | 18,523,891 | 43,499,506 | 174% | 366.1% |
| 13 | Australia | 119,448,071 | 39,585,897 | 20% | -3.4% |
| 14 | Vietnam | 50,188,481 | 35,673,808 | 8.6% | 29.5% |
| 15 | India | 31,437,371 | 27,899,433 | -25.5% | -49.9% |
| 16 | Japan | 49,861,696 | 25,922,292 | 3.6% | 2.2% |
| 17 | Canada | 69,328,713 | 24,228,453 | -7.9% | -14.1% |
| 18 | Kenya | 72,106,193 | 23,871,926 | 54.9% | 30.8% |
| 19 | Israel | 77,377,209 | 21,314,549 | 10.3% | -21% |
| 20 | Iraq | 54,125,834 | 21,104,576 | -6.4% | 0.8% |
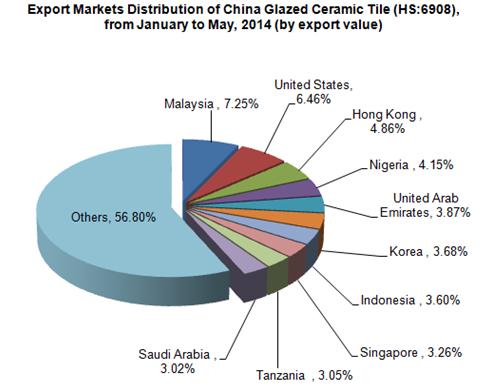
According to the exports data from January to May 2014, it can be seen that main export markets of China glazed Ceramic Tile are Malaysia, United States, Hong Kong, Nigeria, United Arab Emirates, Korea, Indonesia, Singapore, Tanzania, Saudi Arabia and so on.
From January to May 2014, Malaysia, United States and Hong Kong are the top three export markets of China Glazed Ceramic Tile. The export amount of China Ceramic Building Bricks to these three countries, respectively accounts for 7.25%, 6.46% and 4.86% of total exports about such products.
From January to May 2014, among China's Top 20 export markets, export value to Iran grew fastest, having a big increase of 366.1% over the same period in 2013, growing rapidly.
Original Places of Exported Goods of China Glazed Ceramic Tile, from January to May, 2014
| No. | Region | Amount(KG) | Value(US Dollars) | Compared to the same period last year | |
| Amount | Value | ||||
| 1 | Guangdong | 1,809,127,812 | 1,027,688,794 | -5.4% | -11.5% |
| 2 | Fujian | 920,767,862 | 203,615,942 | -11.7% | -11.1% |
| 3 | Shandong | 475,360,567 | 115,673,833 | 37.3% | 35.2% |
| 4 | Jiangxi | 178,402,022 | 83,015,660 | 31.8% | 0.7% |
| 5 | Shanghai | 59,990,003 | 19,420,224 | -0.1% | 15.3% |
| 6 | Liaoning | 61,945,207 | 17,506,549 | 41.2% | -37.4% |
| 7 | Jiangsu | 15,808,330 | 12,330,790 | -7% | -16.3% |
| 8 | Guangxi Zhuang Autonomous Region | 34,145,570 | 11,759,053 | -1.9% | 54.1% |
| 9 | Zhejiang | 32,252,885 | 11,550,149 | 9.3% | 1.7% |
| 10 | Xinjiang Uygur Autonomous Region | 7,682,830 | 10,703,469 | -22.8% | 17.4% |
According to the exports data from January to May 2014, it can be seen that main original places of exported goods of China Glazed Ceramic Tile is Guangdong Province. The export amount of Guangdong Glazed Ceramic Tile accounted for 66.25% of the total China exports of the product.
Compared to the same period last year, from January to May 2014, total export amount of Glazed Ceramic Tile from Guangxi Zhuang Autonomous Region reached US dollars 11,759,100, having an increase of 54.1%, growing rapidly.
Source: Customs Information Network
2014 Global Glazed Ceramic Tile Import Analysis
Main Demand Countries/ Regions Import Value of Global Glazed Ceramic Tile in First Quarter of 2014
| No. | Country/ Region | Cumulative Import Amount from Jan. To Mar. 2014 (thousand dollars) | Compared to the same period last year | |
| 1 | United States | 325,859 | 8.12% | |
| 2 | France | 236,558 | 5.72% | |
| 3 | Germany | 135,144 | 0.95% | |
| 4 | The Russian Federation | 89,551 | -1.50% | |
| 5 | United Kingdom | 69,125 | -19.23% | |
| 6 | Canada | 57,253 | 10.76% | |
| 7 | Australia | 56,887 | 13.79% | |
| 8 | Philippines | 50,334 | 39.96% | |
| 9 | Belgium | 49,250 | 18.95% | |
| 10 | Chile | 47,312 | 5.35% |
From January to March 2014, the main importing countries of global Glazed Ceramic Tile includes United States, France, Germany, the Russian Federation, the United Kingdom, Canada, Australia, the Philippines, Belgium, Chile and so on. Among those countries, the Philippines import amount of Glazed Ceramic Tile grew by 39.96% compared to the same period in 2013, grew rapidly.
Source: UN COMTRADE


