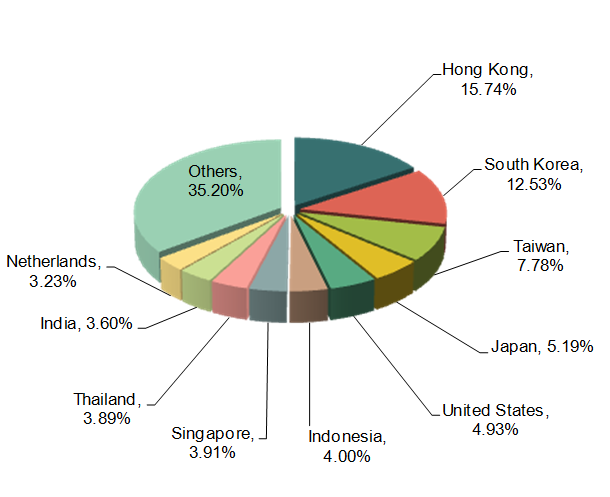
2013 Jan.-Dec. Chinese Major Export Countries /Regions of Inorganics; Precious Metals, Rare Earth Metals, Radioactive Elements and Their Compounds (by Export Value
| No. | Countries /Regions | Jan. to Dec. Total | Year on Year | |||
| Volume | Value ($) | Volume | Value | |||
| 1 | Japan | 1,304,209,136 | 1,707,577,292 | -2.9% | -20.7% | |
| 2 | South Korea | 2,061,216,200 | 1,636,831,772 | 12.8% | 0.4% | |
| 3 | United States | 1,015,508,868 | 1,326,672,147 | 17% | -5.9% | |
| 4 | Taiwan | 675,060,234 | 678,490,005 | 9.2% | 8.7% | |
| 5 | Thailand | 1,071,940,156 | 609,309,269 | 3.2% | 1.7% | |
| 6 | India | 715,612,034 | 588,484,979 | 8.2% | 6.9% | |
| 7 | Indonesia | 1,136,930,254 | 477,154,009 | -12.4% | -6.9% | |
| 8 | Australia | 995,514,019 | 415,432,696 | -7.4% | -26.4% | |
| 9 | Malaysia | 863,340,536 | 406,066,404 | -8.5% | -9.2% | |
| 10 | Hong Kong | 264,002,993 | 390,050,250 | 7.7% | -8.2% | |
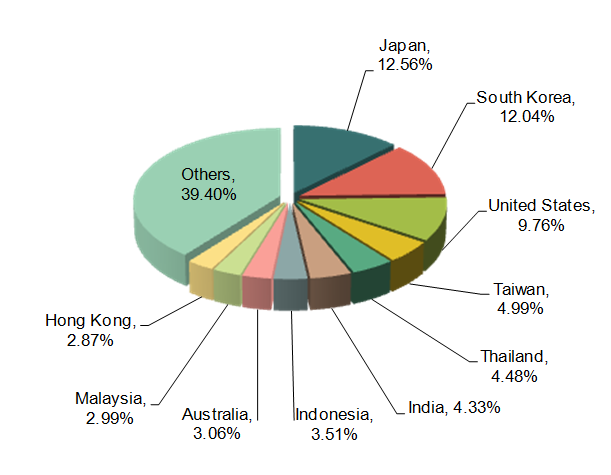
In 2013, Chinese export volume of inorganics; precious metals, rare earth metals, radioactive elements and their compounds was 19.706 billion tons, an increase of 7.4% year on year; while, the export value was 13.591 billion dollars, a decline of 2.8% year on year. Chinese inorganics; precious metals, rare earth metals, radioactive elements and their compounds export countries/ regions were Japan, South Korea, United States, Taiwan, Thailand, India, Indonesia, Australia, Malaysia and Hong Kong, etc, from Jan. to Dec. 2013. Among them, Japan and South Korea were the major export markets in 2013, and the export value respectively accounted for 12.56% and 12.04% of Chinese total export value of these products.
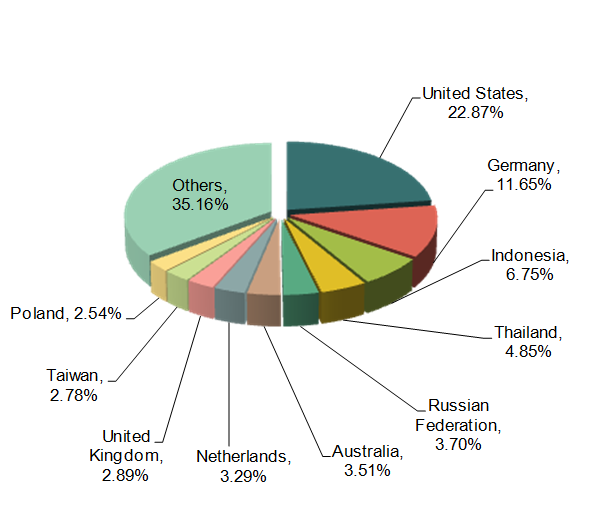
2013 Jan.-Dec. Chinese Major Export Countries /Regions of Organic Chemicals (by Export Value)
| No. | Countries /Regions | Jan. to Dec. Total | Year on Year | |||
| Volume | Value ($) | Volume | Value | |||
| 1 | United States | 1,248,058,980 | 6,318,831,634 | 17.2% | 2.8% | |
| 2 | India | 994,477,328 | 5,234,300,471 | 7% | 10% | |
| 3 | Japan | 887,670,784 | 2,864,660,573 | 13.4% | -1.1% | |
| 4 | South Korea | 1,309,125,785 | 2,502,028,659 | 39.7% | 6.1% | |
| 5 | Brazil | 415,044,691 | 1,901,207,953 | 12.3% | 17.7% | |
| 6 | Netherlands | 366,258,199 | 1,771,143,193 | 2.7% | 4.7% | |
| 7 | Germany | 295,140,898 | 1,745,845,352 | 9.7% | 3.3% | |
| 8 | Taiwan | 670,625,211 | 1,447,358,317 | -2.9% | -5.4% | |
| 9 | Belgium | 248,545,851 | 1,052,470,055 | 18.8% | 3.5% | |
| 10 | Italy | 166,176,073 | 997,418,273 | 2.5% | -2.2% | |
2013 Jan.-Dec. Chinese Major Export Countries /Regions of Tanning, Tannins, Dyes, Paints, Inks(by Export Value)
| No. | Countries /Regions | Jan. to Dec. Total | Year on Year | |||
| Volume | Value ($) | Volume | Value | |||
| 1 | United States | 98,868,795 | 504,074,060 | 9.1% | 4.6% | |
| 2 | Indonesia | 218,996,701 | 405,895,507 | 18.5% | 20.9% | |
| 3 | South Korea | 97,774,104 | 373,756,502 | 5.5% | 7.1% | |
| 4 | India | 77,168,162 | 303,410,654 | -0.8% | 7.8% | |
| 5 | Taiwan | 65,952,676 | 269,589,044 | 13.6% | 18.6% | |
| 6 | Hong Kong | 72,656,339 | 263,663,513 | -7.1% | 3.8% | |
| 7 | Japan | 53,085,350 | 261,587,802 | 7.3% | -1.7% | |
| 8 | Brazil | 75,440,383 | 252,674,747 | 17.8% | 5.3% | |
| 9 | Thailand | 59,291,638 | 220,594,546 | 9.7% | 16.2% | |
| 10 | Viet Nam | 113,258,555 | 203,435,984 | 18.5% | 32.7% | |
2013 Jan.-Dec. Chinese Major Export Countries /Regions of Protein Substances (by Export Value)
| No. | Countries /Regions | Jan. to Dec. Total | Year on Year | |||
| Volume | Value ($) | Volume | Value | |||
| 1 | Hong Kong | 26,202,727 | 244,021,266 | -6.2% | 2.7% | |
| 2 | United States | 69,273,203 | 233,934,998 | -6.8% | 0.1% | |
| 3 | Japan | 73,355,893 | 180,748,220 | 1.9% | 3.4% | |
| 4 | Russian Federation | 51,772,902 | 149,823,815 | -7.3% | 6.7% | |
| 5 | South Korea | 72,370,216 | 106,043,848 | 22.8% | 13.7% | |
| 6 | Viet Nam | 33,759,700 | 98,899,991 | 34.5% | 25% | |
| 7 | India | 26,527,913 | 91,264,579 | 7.6% | 10.7% | |
| 8 | Indonesia | 26,953,872 | 89,103,666 | 23.1% | 32.6% | |
| 9 | Taiwan | 20,626,443 | 87,291,644 | -6.2% | 5% | |
| 10 | Malaysia | 28,827,403 | 82,978,178 | 3.7% | 25.6% | |
2013 Jan.-Dec. Chinese Major Export Countries /Regions of Explosives; Pyrotechnic Products; Pyrophoric Alloys; Combustible Materials (by Export Value)
| No. | Countries /Regions | Jan. to Dec. Total | Year on Year | |||
| Volume | Value ($) | Volume | Value | |||
| 1 | United States | 83,798,208 | 206,360,838 | -8.2% | 2.8% | |
| 2 | Germany | 41,660,137 | 105,130,038 | -1.3% | 6.8% | |
| 3 | Indonesia | 25,483,005 | 60,943,593 | 17.7% | 26.3% | |
| 4 | Thailand | 20,553,133 | 43,758,224 | 4% | 10.6% | |
| 5 | Russian Federation | 18,229,679 | 33,425,976 | -2.8% | 5.3% | |
| 6 | Australia | 4,487,761 | 31,683,243 | -4.6% | 8.8% | |
| 7 | Netherlands | 12,223,188 | 29,684,192 | -8.8% | 2.4% | |
| 8 | United Kingdom | 8,594,329 | 26,096,496 | -27.3% | -14% | |
| 9 | Taiwan | 14,174,130 | 25,051,090 | 23.8% | 40.2% | |
| 10 | Poland | 11,272,760 | 22,911,715 | 3.4% | 20% | |
2013 Jan.-Dec. Chinese Major Export Countries /Regions of Photographic and Film Products (by Export Value)
| No. | Countries /Regions | Jan. to Dec. Total | Year on Year | |||
| Volume | Value ($) | Volume | Value | |||
| 1 | Hong Kong | 19,007,966 | 191,725,734 | -35.3% | -4.8% | |
| 2 | South Korea | 43,060,279 | 152,569,129 | 0.9% | 6.2% | |
| 3 | Taiwan | 17,792,158 | 94,792,581 | 3.9% | 17.2% | |
| 4 | Japan | 8,309,523 | 63,167,822 | 31.1% | -1.2% | |
| 5 | United States | 7,187,436 | 60,012,998 | 3.6% | -9.7% | |
| 6 | Indonesia | 8,597,409 | 48,672,592 | -4.2% | -4.7% | |
| 7 | Singapore | 7,528,145 | 47,562,085 | 11.3% | 7.7% | |
| 8 | Thailand | 8,735,881 | 47,387,877 | -2.1% | -18.5% | |
| 9 | India | 6,435,371 | 43,886,475 | -21.7% | -13% | |
| 10 | Netherlands | 3,651,856 | 39,325,175 | -26.1% | -30.3% | |
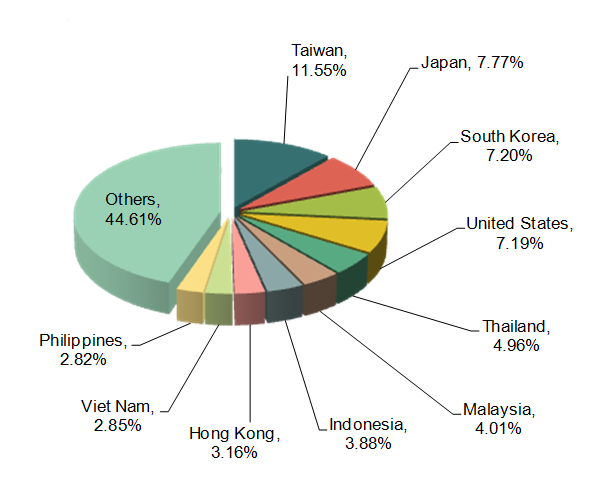
2013 Jan.-Dec. Chinese Major Export Countries /Regions of Miscellaneous Chemical Products (by Export Value)
| No. | Countries /Regions | Jan. to Dec. Total | Year on Year | |||
| Volume | Value ($) | Volume | Value | |||
| 1 | Taiwan | 255,312,971 | 1,421,866,185 | 12.2% | 16.6% | |
| 2 | Japan | 1,268,403,088 | 956,336,569 | 4% | -11.3% | |
| 3 | South Korea | 688,802,183 | 885,935,490 | 11.4% | 20.1% | |
| 4 | United States | 383,248,522 | 884,940,032 | 6.6% | -2.4% | |
| 5 | Thailand | 362,320,518 | 610,522,570 | 21.3% | 30.5% | |
| 6 | Malaysia | 243,030,283 | 493,719,096 | 12.8% | 16.6% | |
| 7 | Indonesia | 370,608,463 | 477,174,835 | 53.2% | 57.4% | |
| 8 | Hong Kong | 192,465,116 | 388,710,082 | -4.7% | -22.3% | |
| 9 | Viet Nam | 255,901,039 | 350,557,038 | 19.5% | 25.5% | |
| 10 | Philippines | 159,426,628 | 347,498,114 | 25% | 78.9% | |
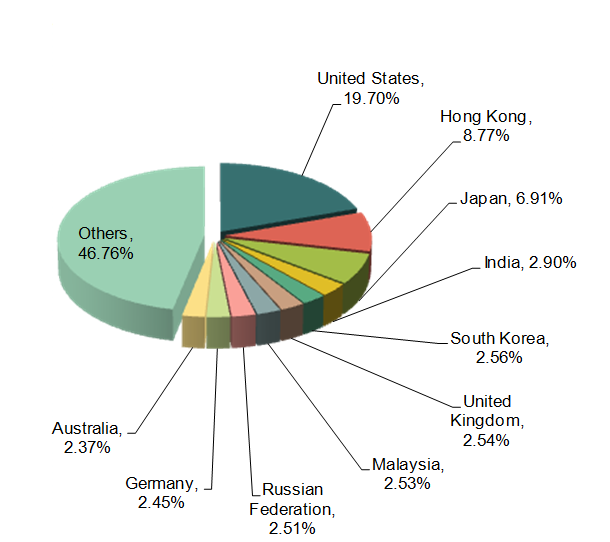
2013 Jan.-Dec. Chinese Major Export Countries /Regions of Plastics and Articles Thereof (by Export Value)
| No. | Countries /Regions | Jan. to Dec. Total | Year on Year | ||||
| Volume | Value ($) | Volume | Value | ||||
| 1 | United States | 3,440,690,235 | 12,167,279,623 | 4.8% | 5% | ||
| 2 | Hong Kong | 1,333,246,365 | 5,417,011,181 | -8.8% | 26% | ||
| 3 | Japan | 1,318,866,402 | 4,265,264,440 | 7.7% | 6.2% | ||
| 4 | India | 674,855,127 | 1,792,341,306 | 27.4% | 31.3% | ||
| 5 | South Korea | 518,363,901 | 1,580,913,576 | 9.2% | 9.6% | ||
| 6 | United Kingdom | 384,367,586 | 1,570,718,629 | 6.8% | 7% | ||
| 7 | Malaysia | 458,937,153 | 1,560,860,212 | 20.3% | 27.4% | ||
| 8 | Russian Federation | 659,381,597 | 1,552,659,232 | 14.6% | 14.2% | ||
| 9 | Germany | 360,894,448 | 1,512,272,033 | 5.2% | 1.3% | ||
| 10 | Australia | 431,610,293 | 1,466,638,184 | 7.5% | 7.9% | ||
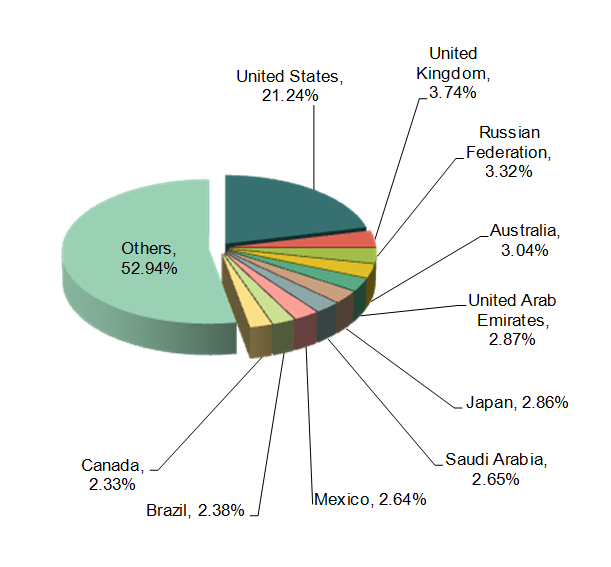
2013 Jan.-Dec. Chinese Major Export Countries /Regions of Rubber and Articles Thereof(by Export Value)
| No. | Countries /Regions | Jan. to Dec. Total | Year on Year | |||
| Volume | Value ($) | Volume | Value | |||
| 1 | United States | 1,380,945,579 | 4,913,795,235 | 19.2% | 11.2% | |
| 2 | United Kingdom | 243,362,177 | 864,445,743 | 19.4% | 10.8% | |
| 3 | Russian Federation | 246,986,107 | 767,808,087 | 12.1% | 1.5% | |
| 4 | Australia | 194,854,536 | 702,756,379 | -5.7% | -15.1% | |
| 5 | United Arab Emirates | 217,604,847 | 663,565,532 | -11.6% | -17.6% | |
| 6 | Japan | 122,975,816 | 661,334,597 | 4.7% | -4.8% | |
| 7 | Saudi Arabia | 215,786,849 | 612,201,364 | 6.6% | -5.6% | |
| 8 | Mexico | 184,691,230 | 610,633,066 | 11% | 1.1% | |
| 9 | Brazil | 169,903,265 | 551,437,352 | 12% | 8.2% | |
| 10 | Canada | 152,152,416 | 539,443,642 | 2.9% | -5.3% | |
Source: China Customs


