Producer Prices for the Industrial Sector for July National Bureau of Statistics of China 2013-08-09 13:27:51
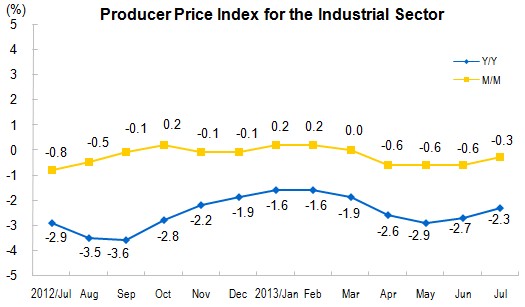
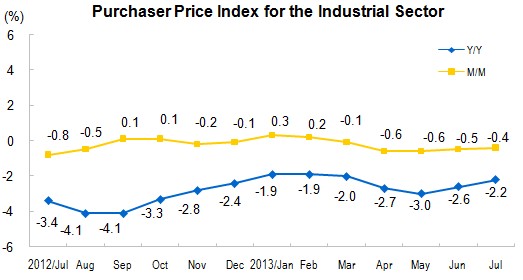
In July 2013, Producer Price Index (PPI) for manufactured goods decreased 2.3 percent year-on-year, and decreased 0.3 percent month-on-month. The purchasing price index for manufactured goods went down by 2.2 percent year-on-year, and 0.4 percent decrease month-on-month. In the first seven months of 2013, the PPI decreased 2.2 percent, year-on-year, the purchasing price index for manufactured goods went down by 2.3 percent year-on-year.
1. Year-on-Year Changes of Prices of Different Categories
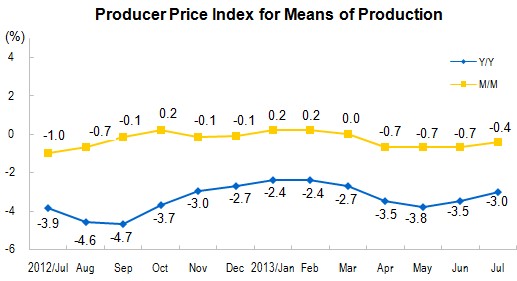
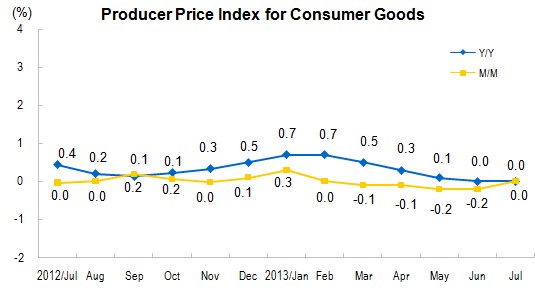
The year-on-year change of producer prices for means of production decreased 3.0 percent, meaning 2.26 percentage points decrease in the overall price level. Of which, producer prices for mining and quarrying industry decreased 6.0 percent; that of raw materials industry decreased 3.2 percent, that of manufacturing and processing industry decreased 2.6 percent. Producer prices for consumer goods kept at the same level (the amount of change was 0) year-on-year. Of which, producer prices for foodstuff increased 0.4 percent, that of clothing increased 1.0 percent, that of commodities down by 0.5 percent, while that of durable consumer goods dropped 0.9 percent.
The year-on-year purchaser price indexes for ferrous metal materials decreased 5.9 percent, non-ferrous metal materials and wires fell 5.8 percent, fuel and power decreased 3.4 percent, chemical raw materials went down by 2.4 percent, agricultural and sideline products prices rose by 1.8 percent.
According to estimation, in the -2.3 percent decrease in July, the carryover effect of last year's prices changing was -0.6 percentage points, while new prices rising factors in this year accounted for -1.7 percentage point.
2. Month-on-Month Changes of Prices of Different Categories
The producer prices for means of production decreased 0.4 percent month-on-month. Of the total, producer prices for mining and quarrying industry decreased 1.0 percent, that of raw materials industry decreased 0.6 percent, that of manufacturing and processing industry went down by 0.3 percent. Producer prices for consumer goods remained at the same level month-on-month. Of which, producer prices for foodstuff and clothing remained at the same level month-on-month, that of commodities and durable consumer goods both decreased 0.1 percent.
The month-on-month purchaser price indexes for non-ferrous metal materials and wires went down by 1.7 percent, ferrous metal materials decreased 0.6 percent, fuel and power went down by 0.6 percent, chemical raw materials decreased 0.5 percent, agricultural and sideline products increased 0.3 percent.
Price Indexes for the Industrial Sector in July
| July | Average on Jan-Jul | ||
| M/M(%) | Y/Y(%) | Y/Y(%) | |
| I. Producer Price Indexes | -0.3 | -2.3 | -2.2 |
| Means of production | -0.4 | -3 | -3 |
| Mining and quarrying | -1 | -6 | -6.8 |
| Raw materials | -0.6 | -3.2 | -3.6 |
| Processing | -0.3 | -2.6 | -2.4 |
| Means of subsistence | 0 | 0 | 0.3 |
| Food | 0 | 0.4 | 0.8 |
| Clothing | 0 | 1 | 1.3 |
| Articles for daily use | -0.1 | -0.5 | 0.1 |
| Durable consumer goods | -0.1 | -0.9 | -0.8 |
| II. Purchaser Price Indexes | -0.4 | -2.2 | -2.3 |
| Fuel and Power | -0.6 | -3.4 | -3.9 |
| Ferrous Metals | -0.6 | -5.9 | -5.8 |
| Non-ferrous Metal Materials and Wires | -1.7 | -5.8 | -3.9 |
| Chemical Raw Materials | -0.5 | -2.4 | -3.2 |
| Wood and Pulp | 0 | -0.6 | -0.6 |
| Building Materials and Non-metallic | -0.3 | -1.4 | -1.7 |
| Other Industrial Raw Materials and Semi-products | -0.2 | -1 | -0.9 |
| Agricultural and Sideline Products | 0.3 | 1.8 | 1.7 |
| Textile Raw Materials | -0.1 | 0.2 | -0.5 |
Annotations:
1. Explanatory Notes
Producer Price Index for manufactured goods consists of producer price index and purchaser price index.
The industrial producer price index reflects the trend and level of prices change when the products are sold for the first time.
The industrial purchaser price index reflects the trend and level of prices change for the products purchased by the industrial enterprises as intermediate inputs.
2. Statistical Coverage
The statistical survey of industrial producer prices covers prices for over 11,000 products from 1702 subclasses, 191 groups; and the statistical surveys of industrial purchaser prices cover prices for over 6,000 industrial products from over 900 subclasses.
3. Survey Methods
Industrial producer prices are collected from combined surveys of key businesses and typical businesses. Starting from 2011, the key businesses are those with their turnover from primary activities over 20 million yuan, and the typical businesses are those with less than 20 million yuan. The surveys cover about 60,000 industrial enterprises in over 400 cities across the country.


