In October, China's manufacturing purchasing managers index (PMI) was 50.2 percent, up by 0.4 percentage points month-on-month, back above the threshold.
In view of the sizes of enterprises, the PMI of large-sized enterprises was 50.9 percent, increased 0.7 percentage points month-on-month, stayed above the threshold for two consecutive months, and was the main driving force for the overall recovery of the manufacturing economy in October. That of medium-sized enterprises was 49.3 percent, decreased 0.5 percentage points month-on-month, That of small-sized enterprises was 47.2 percent, increased 0.5 percentage points month-on-month.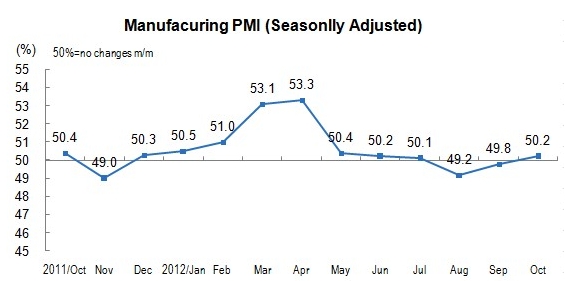
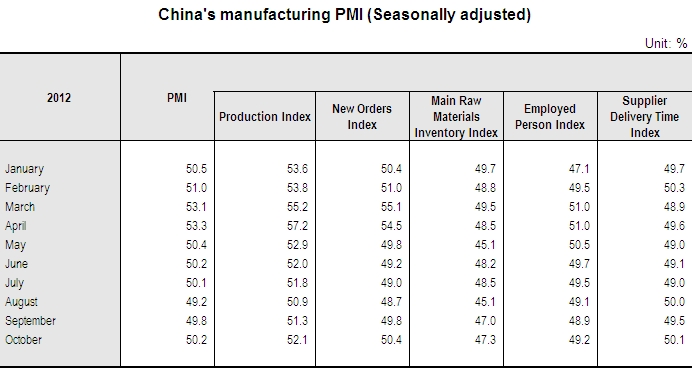
In October, the five sub-indices composing PMI all increased.
Production index was above the threshold, which was 52.1 percent, increased 0.8 percentage points month-on-month, indicating that manufacturing production kept expanding, and the growth rate kept increasing for two consecutive months. In view of different industries, textile and apparel industry, processing of timber and furniture manufacturing, processing and coking of petroleum, electrical machinery and equipment manufacturing, ferrous metal mining and processing increased, and in particular, the production of ferrous metal mining and processing rose again significantly this month after falling sharply for three consecutive months. The production indices of tobacco manufacturing, paper and printing industry, cultural, educational, sporting goods manufacturing, foods, liquor, beverages and fine tea manufacturing, fabricated metal products manufacturing, special equipment manufacturing, chemical fiber manufacturing, rubber and plastic manufacturing, positioned below the threshold, and the production outputs fell back.
In October, the new orders index was 50.4 percent, up by 0.6 percentage points month-on-month, positioned above threshold for the first time since May 2012, showing that the manufacturing product orders from customers turned to increase from decrease, and market demand has improved. In view of different industries, the market demand of textile and apparel industry, processing and coking of petroleum, ferrous metal mining and processing, pharmaceutical manufacturing increased. The new orders indices of special equipment manufacturing, fabricated metal products manufacturing, tobacco manufacturing, paper and printing industry, cultural, educational, sporting goods manufacturing, foods, liquor, beverages and fine tea manufacturing, chemical fiber manufacturing, rubber and plastic manufacturing, positioned below the threshold, and the market demand decreased. The survey results showed that foreign new orders index which reflects the situation of foreign trade of manufacturing was 49.3 percent, increased 0.5 percentage points, month-on-month; the import index was 48.4 percent, increased 0.7 percentage points month-on-month. Although both the indices were still below the threshold, they showed a continuous trend of rebounding, indicating that the foreign trade situation of manufacturing has improved.
Main raw materials inventory index was 47.3 percent, up by 0.3 percentage points month-on-month, still below the threshold, which indicated that the raw materials inventory continued to reduce, while that of decreasing amplitude narrowed. In view of different industries, the main raw materials inventory indices of pharmaceutical manufacturing, processing of timber and furniture manufacturing, textile and apparel industry, foods, liquor, beverages and fine tea manufacturing, gained increase; that of fabricated metal products manufacturing, textile industry, smelting and processing of non-ferrous metal ores, special equipment manufacturing, chemical fiber manufacturing, rubber and plastic manufacturing, non-metallic mineral products manufacturing, were below the threshold, the main raw materials inventory continued to decrease.
Employed person index was 49.2 percent, increased 0.3 percentage points month-on-month. In view of different industries, employed person indices of pharmaceutical manufacturing, tobacco manufacturing, agro-food processing industry were above the threshold, employment increased; employment of fabricated metal products manufacturing, textile industry, processing and coking of petroleum continued to decrease.
Supplier delivery time index was 50.1 percent, 0.6 percentage points higher month-on-month, slightly higher than the threshold, which indicated that the manufacturing supplier delivery time has got shorter a little bit.
Main raw material purchase price index was 54.3 percent, up by 3.3 percentage points month-on-month. This index rose month by month since August 2012, and stayed above the threshold for two consecutive months, which indicated that the overall manufacturing main raw material purchase price continued to increase. In view of different industries, the month-on-month prices of chemical fiber manufacturing, rubber and plastic manufacturing, processing and coking of petroleum, tobacco manufacturing, ferrous metal mining and processing, manufacture of raw chemical materials and chemical products, increased with a significant move; that of automobile manufacturing, manufacturing of general equipment, continued to stay below the threshold, and main raw material purchase price declined sequentially.
Annotations:
Explanatory Notes
Purchasing Managers Index (PMI) is an index summarized and compiled through the results of the monthly survey of enterprises purchasing managers. It covers every links of the enterprises, including purchasing, production, logistics, and so on. It is one of the leading indices which was commonly adopted by international society to monitor the macroeconomic trends, and played an important role in forecasting and monitoring. The threshold of PMI is usually using 50 percent as the cut-off point for economic performance. If PMI above 50 percent, it reflects the manufacturing economy is expanding; if less than 50 percent, it reflects the manufacturing economy is in recession.
2.Statistical Coverage
The survey involves 31 divisions of manufacturing sector in the “Industrial Classification for National Economic Activities” (GB/T4754-2011), and totally 820 sampling enterprises are selected and surveyed countrywide.
3. Survey Methods
PPS (Probability Proportional to Size) sampling method was adopted in manufacturing purchasing managers’ survey. Using the divisions of the manufacturing sector as the selecting strata, the sample size of each division is proportional to its proportion of the value-added of the division to the total value-added of the manufacturing sector. Within the stratum, the samples are selected according to the probabilities proportional to their principal business revenues of the enterprises.
The survey was conducted monthly through Online Reporting System of NBS by sending survey questionnaires to the purchasing managers of the selected enterprises.
4. Calculation Methods
The questionnaire of manufacturing purchasing managers survey covers 11 questions related to production, new orders, export orders, existing orders, finished goods inventory, purchase, import, purchase prices, raw materials, inventory, employees, suppliers, delivery time, and etc.. Diffusion index was calculated for each question, i.e. percentage of positive answers in number of enterprises plus half of the percentage in the same answers.
PMI is a composite index, which was calculated according to five diffusion indices (group indices) and their weights. 5 group indices and their weights are determined in accordance with their leading impact on the economy. Specifically, new orders index weighted 30 percent; production index weighted 25 percent; employees index weighted 20 percent; supplier delivery time index weighted 15 percent; raw materials inventory index weighted 10 percent. Of which, the supplier delivery time index is a converse index, and contrary calculation is needed when combines it into PMI.
5. Seasonal Adjustment
The purchasing managers’ survey is a monthly survey, the data of the survey fluctuates very much for the influences of seasonal factors. The released PMI composite index and sub-indices are seasonally adjusted data.


