Investment in Fixed Assets for January to September 2013 National Bureau of Statistics of China 2013-10-21 08:16:16
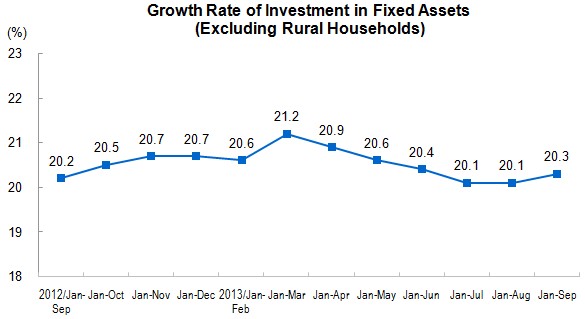
From January to September 2013, the investment in fixed assets (excluding rural households) reached 30,920.8 billion yuan, up by 20.2 percent year-on-year in nominal terms (the real growth rate was 20.2 percent, after deducting price factors), the growth rate dropped 0.1 percentage point over that in the first eight months of 2013. In September, the investment in fixed assets (excluding rural households) increased 1.28 percent, month-on-month.
In term of different industries, from January to September, the investment in primary industry was 679.9 billion yuan, went up by 31.1 percent year-on-year, decreased 0.9 percentage point over that in the first eight months; that of secondary industry was 13,260.7 billion yuan, went up by 17.1 percent, increased 0.5 percentage point; that of tertiary industry was 16,980.2 billion yuan, went up by 22.3 percent, decreased 0.7 percentage point over last month. In secondary industry, the investment in industry reached 13,038.6 billion yuan, increased 17.7 percent, and the growth rate increased 0.5 percentage point over that in the first eight months. Of which, the investment in mining industry stood at 983.5 billion yuan, went up by 11.1 percent, increased 1.1 percentage points; that of manufacture, 10,677.3 billion yuan, increased 18.5 percent, increased 0.6 percentage point; that of production and supply of electric power, heat power, gas and water, 1,377.8 billion yuan, climbed 17.0 percent, and decreased 0.1 percentage point.
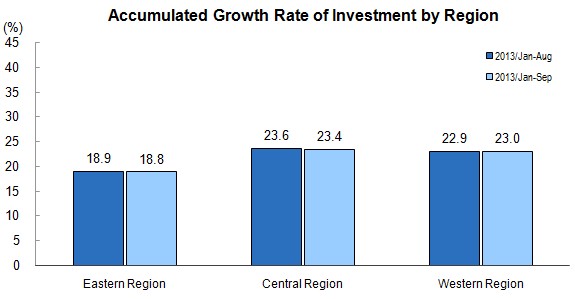
In term of different areas, from January to September, the investment in eastern region amounted to 14,464.6 billion yuan, rose by 18.8 percent year-on-year, and 0.1 percentage point lower than that in the first eight months; that of central region, 8,680.0 billion yuan, surged 23.4 percent, and 0.2 percentage point lower than that in the first eight months; that of western region, 7,591.9 billion yuan, increased 23.0 percent, and 0.1 percentage point higher than that in the first eight months.
In term of types of registration, from January to September, the investment by domestic enterprises was 29,168.6 billion yuan, up by 21.0 percent year-on-year, and 0.4 percentage point lower than that in the first eight months; investment by funds from Hong Kong, Macao and Taiwan was 799.5 billion yuan, up by 9.3 percent, 0.3 percentage point higher; and the investment by foreign funds was 806.1 billion yuan, up by 5.2 percent, 0.1 percentage point lower.
In terms of jurisdiction of project management, from January to September, the central investment reached 1,502.0 billion yuan, increased 10.4 percent year-on-year, decreased 0.4 percentage point than that in the first eight months; while the local investment was 29,418.8 billion yuan, up by 20.7 percent, and decreased 0.1 percentage point.
Analysis on projects under construction or started this year showed that, from January to September, the total planned investment in projects under construction reached 76,041.7 billion yuan, up by 18.6 percent year-on-year, decreased 0.3 percentage point than that in the first eight months. The total planned investment in newly started projects was 26,549.7 billion yuan, up by 13.3 percent year-on-year, decreased 1.1 percentage points.
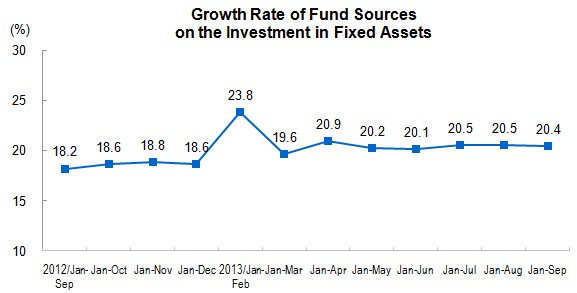
In terms of paid-in funds, from January to September, 34,854.0 billion yuan had been invested, rose by 20.4 percent year-on-year, decreased 0.1 percentage point than that in the first eight months. Of this total, the growth of government budgetary funds went up by 16.6 percent, 3.0 percentage points lower; investment from domestic loans went up by 16.6 percent, 0.4 percentage point higher; that from self-raising funds went up by 20.1 percent, 0.5 percentage point higher; that from foreign investment decreased 8.5 percent, 4.1 percentage points lower; other investment rose by 29.6 percent, 2.4 percentage points lower.
Investment in Fixed Assets For January to September
| Indicators | Jan-Sep | |
| Absolute Value | Increase rate Y/Y | |
| (%) | ||
| Investment in Fixed Assets (Exclude Rural Households) (100 million yuan) | 309208 | 20.2 |
| Of which: State-owned and State Holding | 99001 | 17.6 |
| Grouped by Jurisdiction of Project Management | ||
| Central Investment | 15020 | 10.4 |
| Local Investment | 294188 | 20.7 |
| Grouped by Types of Industry | ||
| Primary Industry | 6799 | 31.1 |
| Secondary Industry | 132607 | 17.1 |
| Tertiary Industry | 169802 | 22.3 |
| Grouped by Industrial Sectors | ||
| Agriculture, Forestry, Animal Husbandry and Fishery | 8494 | 29.8 |
| Mining | 9835 | 11.1 |
| Of which: Mining and Washing of Coal | 3725 | -0.3 |
| Extraction of Petroleum and Natural Gas | 1912 | 26.1 |
| Ore Mining, Smelting and Pressing of Ferrous Metals | 1263 | 11.5 |
| Ore Mining, Smelting and Pressing of Non-Ferrous Metal | 1247 | 13.9 |
| Ore Mining, Processing of Non-Metallic Minerals | 1332 | 16.4 |
| Manufacturing | 106773 | 18.5 |
| Of which: Manufacture of Non-metallic Mineral Products | 10108 | 14.6 |
| Smelting and Pressing of Ferrous Metals | 3794 | 2.6 |
| Smelting and Pressing of Non-Ferrous Metal | 3999 | 21.9 |
| Manufacture of General Purpose Machinery | 7619 | 22.4 |
| Manufacture of Special Purpose Machinery | 7243 | 18.9 |
| Manufacture of automobile | 6821 | 15.4 |
| Manufacture of railways, shipbuilding, aerospace and other transportation equipment | 1928 | 14 |
| Manufacture of Electrical Machinery & Equipment | 6625 | 8.5 |
| Manufacture of Telecommunications Equipment, Computers and Other Electronic Equipment | 5174 | 21.7 |
| Production and Supply of Electricity ,Gas and Water | 13778 | 17 |
| Of which: Production and Supply of Electric Power and Heat Power | 10363 | 12.6 |
| Construction | 2761 | -5.4 |
| Transport, Storage and Post | 24105 | 23.3 |
| Of which: Railway Transportation | 3401 | 10.2 |
| Road Transportation | 14259 | 23.8 |
| Management of Water Conservancy, Environment and Public Facilities | 26045 | 29.3 |
| Of which: Management on Water Resource | 3401 | 28.3 |
| Management on Public Facilities | 21627 | 29.4 |
| Education | 3946 | 20.2 |
| Health, Social Works | 2223 | 22.7 |
| Culture, Sports and Entertainment | 3731 | 27 |
| Public Management, Social Security and Social Organizations | 4118 | -8.5 |
| Grouped by Registration Type | ||
| Domestic Funded | 291686 | 21 |
| Funds from Hong Kong, Macao and Taiwan | 7995 | 9.3 |
| Foreign Investment | 8061 | 5.2 |
| Grouped by Construction and New Projects | ||
| Total Investment in Construction Project | 760417 | 18.6 |
| Total Planned Investment in New Projects | 265497 | 13.3 |
| Funds in Place for Investment (Exclude Rural Households) | 348540 | 20.4 |
| Of which: Government Budgetary Funds | 15927 | 16.6 |
| Domestic Loans | 42700 | 16.6 |
| Foreign Investment | 3250 | -8.5 |
| Self-Raising Funds | 236765 | 20.1 |
| Other Funds | 49898 | 29.6 |
Note:
1.The growth rate in this table are all nominal growth rate.
2.For parts of data, the total is not equal to the total of sub-items due to round-off.
Annotations:
1. Explanatory Notes on Indicators
Investment in fixed assets (excluding rural households): refers to the total workload on construction and purchase for fixed assets during a certain period in the form of currency, as well as the concerning expenses.
Paid-in fund: refers to all funds received by investment units used for fixed assets during the reference period, including state budgetary fund, domestic loans, foreign investment, self-raised funds, and others.
Newly started project: refers to all newly started construction projects during the reference period.
State-owned and Stat-holding Enterprises: including absolutely state-holding enterprises, relatively state-holding enterprises and consultatively state-holding enterprises. Absolutely state-holding enterprises refer to those enterprises that the proportion of state investment capital to the total actual capital (or capital stock) is larger than 50 percent.
Relatively state-holding enterprises refer to those enterprises that the proportion of state investment capital to the total actual capital (or capital stock) is less than 50 percent, but larger than any other single share holders. Consultatively state-holding enterprises refer to those enterprises that the proportion of state investment capital to the total actual capital (or capital stock) is less than other share holders, but owning the real control power regulated by agreement.
The enterprises which the proportion of investment capital of the two investors is 50 percent, and the share holding control power is not clearly stated by either side, if one of them is state-owned, are all classified as the state-holding enterprises without exception.
The investment projects invested by the administrative and institutional units are all classified as state-holding.
Types of Registration: the types of registration on the enterprises are based on the Provisions for the Classification of Types of Enterprise Registration jointly issued by NBS and State Administration of Industry and Commerce. And that on the individual operation is based on Note on the Code & Classification of Types of Individual Operation Registration.
According to the provision of statistical reporting system, all grassroots units shall fill in registration types. The registration types shall be filled in by the enterprises or individual operation units engaged in investment in fixed assets. Those who have already registered in the industrial and commercial administrative units, shall fill in based on the registration types, if unregistered, shall be filled in based on the registration types of investors or that on the provisions of related papers.
Domestic enterprise includes state-owned enterprise, collective enterprise, joint enterprise, limited liability enterprise, share-holding enterprise, private enterprise and others.
Enterprises with funds from Hong Kong, Macao and Taiwan includes joint-venture and cooperation by Hong Kong, Macao and Taiwan, Hong Kong, Macao and Taiwan Sole Investment, Hong Kong, Macao and Taiwan Funded Share-holding Corporations Ltd., and other investment enterprises by Hong Kong, Macao and Taiwan.
Foreign investment enterprise includes joint-venture and cooperation enterprises, foreign funded enterprise, foreign funded share-holding corporations Ltd., and other foreign investment enterprises.
2. Statistical Coverage
Refers to construction projects on fixed assets and real estates involving a total planned investment of 5 million yuan and over.
3. Data Collection
The report of investment on fixed assets is collected monthly with complete enumeration (no report in January).
4. Classification on East, Central and West Region
Eastern region: including Beijing, Tianjin, Hebei, Shanghai, Jiangsu, Zhejiang, Fujian, Shandong, Guangdong and Hainan. Central region: including Shanxi, Anhui, Jiangxi, Henan, Hubei and Hunan. Western region: including Inner Mongolia, Guangxi, Chongqing, Sichuan, Guizhou, Yunnan, Tibet, Shaanxi, Gansu, Qinghai, Ningxia and Xinjiang.
5. Standard Industrial Classification
Since 2012, NBS performed the new standard on industrial classification for national economic activities (GB/T 4754-2011), please refer to http://www.stats.gov.cn/tjbz
6. Explanatory Notes on Growth Rate
The growth rate of investment in fixed assets are calculated in nominal except that in Jan.- Mar., Jan.-Jun., Jan-Sep. and Jan.-Dec. in case of the price indices of investment in fixed assets are calculated on quarterly.
7. Revision on Month-on-Month Data
According to the auto-revision function of the seasonal adjustment model, the month-on-month growth rate of investment on fixed assets from August 2012 to September 2013 has been revised as follows.


