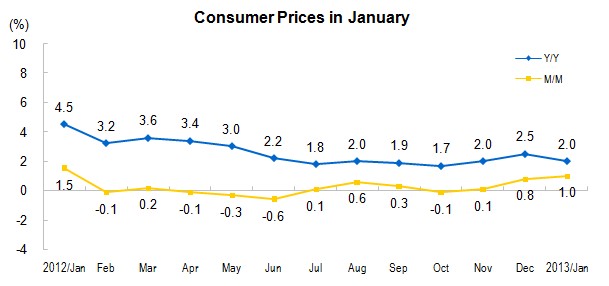
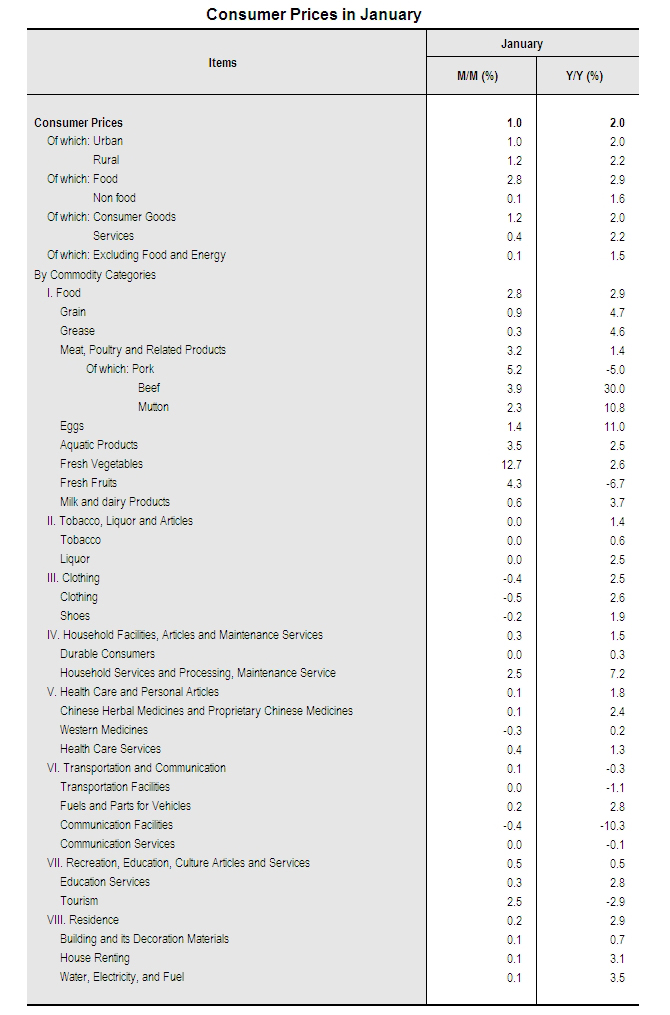
In January, the consumer price index (CPI) went up by 2.0 percent year-on-year. The prices grew by 2.0 percent in cities and 2.2 percent in rural areas. The food prices went up by 2.9 percent, while the non-food prices increased by 1.6 percent. The prices of consumer goods went up by 2.0 percent and the prices of services grew by 2.2 percent.
In January, the month-on-month change of consumer prices was up by 1.0 percent, prices in cities went up 1.0 percent, and rural areas grew 1.2 percent. The food prices increased 2.8 percent, the non-food prices increased 0.1 percent. The prices of consumer goods increased 1.2 percent, and the prices of services increased 0.4 percent.
I. Year-on-Year Changes of Prices of Different Categories
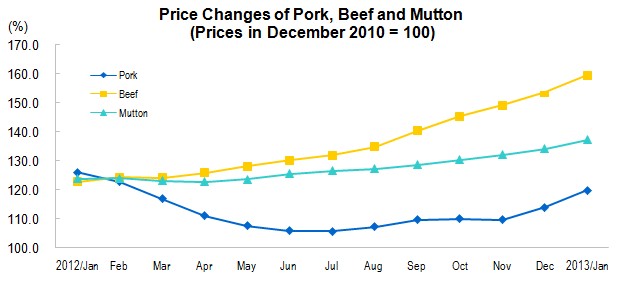
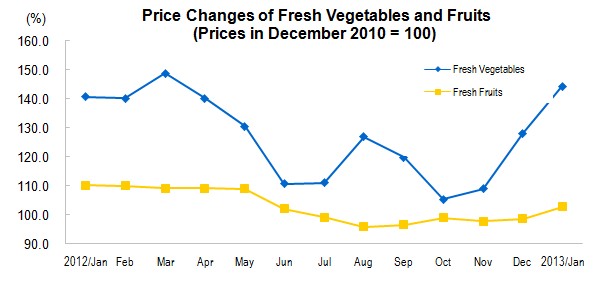
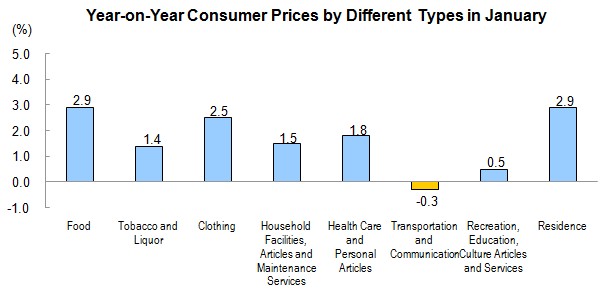
In January, food prices went up by 2.9 percent year-on-year, affecting nearly 0.95 percentage points increase in the overall price level. Of which, the prices of grain rose by 4.7 percent, meaning 0.13 percentage points growth in the overall price level; meat, poultry and related products up by 1.4 percent, affecting nearly 0.11 percentage points increase in the overall price level (price of pork was down by 5.0 percent, affecting nearly 0.18 percentage points decrease in the overall price level); fresh vegetables, grew 2.6 percent, affecting nearly 0.09 percentage points increase in the overall price level; grease, increased 4.6 percent, affecting nearly 0.06 percentage points increase in the overall price level; aquatic products, up by 2.5 percent, affecting nearly 0.06 percentage points increase in the overall price level; fresh fruits, down by 6.7 percent, affecting nearly 0.14 percentage points decrease in the overall price level.
Prices for tobacco and liquor went up by 1.4 percent year-on-year, of which, that of liquor was up by 2.5 percent and tobacco was up by 0.6 percent.
Prices for clothing rose by 2.5 percent year-on-year. The prices for clothes went up by 2.6 percent while the prices for shoes increased 1.9 percent.
Prices for household facilities, articles and maintenance services went up by 1.5 percent year-on-year, of which, prices for household services and processing, maintenance services, up by 7.2 percent, and durable consumer goods was up by 0.3 percent.
Prices for health care and personal articles grew by 1.8 percent year-on-year. Of which, prices for traditional Chinese herbal medicines and proprietary Chinese medicines, up by 2.4 percent, medical apparatus and supplies increased 1.7 percent, health care services, up by 1.3 percent, and western medicine went up by 0.2 percent.
Prices for transportation and communication dropped 0.3 percent year-on-year. Of which, communication facilities, down by 10.3 percent, transportation facilities down by 1.1 percent, vehicles use and maintenance, up by 4.4 percent, prices for fuels and parts for vehicles, up by 2.8 percent.
Prices for recreation, education, culture articles and services grew by 0.5 percent year-on-year. Of which, education service, up by 2.8 percent, recreation and culture, up by 2.1 percent, durable consumer goods for recreational and cultural use and services, down by 4.6 percent, touring and outing, down by 2.9 percent, durable consumer
Prices for residence went up by 2.9 percent year-on-year. Of which, prices for water, electricity and fuel, up 3.5 percent, house renting, up 3.1 percent, and building and building decoration materials rose by 0.7 percent.
According to estimation, in the 2.0 percent growth in January, the carryover effect of last year’s prices rising accounted for 1.0 percentage points, while new prices rising factors in this year accounted for 1.0 percentage points.
II. Month-on-Month Changes of Prices of Different Categories
In January, food prices grew by 2.8 percent month-on-month, contributing 0.92 percentage points to the month-on-month increase of consumer prices. In January, prices for fresh vegetables surged 12.7 percent, contributing 0.39 percentage points decrease in the overall price level; meat, poultry and related products, aquatic products, and fresh fruits down by 3.2, 3.5, and 4.3 percent respectively, affecting nearly 0.24, 0.09, and 0.08 percentage points increase in the overall price level. Prices for eggs and grain increased 1.4 and 0.9 percent, the above two affecting nearly 0.04 percentage points increase in the overall price level; prices for pork up by 5.2 percent, affecting nearly 0.17 percentage points increase in the overall price level.
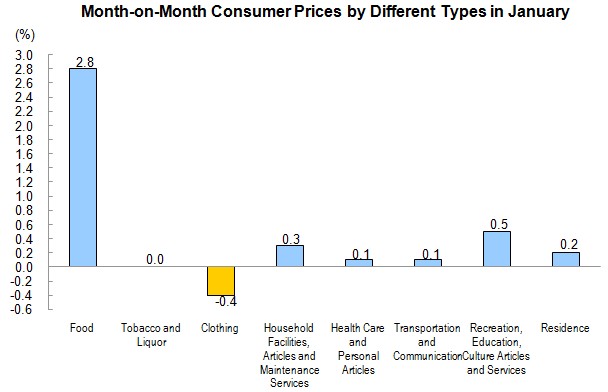
Non-food prices increased 0.1 percent in January, month-on-month. Of which, the month-on-month price for tobacco and liquor remained at the same level (the amount of change was 0), recreation, education, culture articles and services, household facilities, articles and maintenance services, residence, health care and personal articles, and transportation and communication increased 0.5, 0.3, 0.2, 0.1, and 0.1 percent respectively, while that of clothing declined 0.4 percent, month-on-month.
Annotations:
1. Explanatory Notes
Consumer Price Index (CPI) is an index measuring changes over time in the price level of consumer goods and services purchased by residents, which comprehensively reflects the changes of price level.
2. Statistical Coverage
Consumer Price Index (CPI) covers the prices of goods and services of eight categories and 262 basic divisions which cover the living consumption of urban and rural residents, including food; tobacco, liquor and articles; clothing; household facilities, articles and maintenance services; health care and personal articles; transportation and communication; recreation, education, culture articles and services and residence. Data are collected from 63,000 prices collection units in 500 cities and counties of the 31 provinces (autonomous regions and municipalities), which cover grocery stores, department stores, supermarkets, convenience stores, professional markets, franchise houses, sh opping centers, open fairs and service consuming units etc.
3. Survey Methods
The prices collection units are selected and determined by sample survey methods, and the original data of consumer prices are collected by specific person in fixed place at fixed time.


