China’s Export Volume & Value of other String Musical Instruments (e.g. guitars, violins, harps)
| No. | Volume | Value(USD) | Year-on-Year | |
| Volume | Value | |||
| Jan. | 928,670 | 45,090,202 | -16% | -0.30% |
| Feb. | 977,671 | 42,375,494 | 161.90% | 192.70% |
| Mar. | 403,225 | 17,091,533 | -27.30% | -16.10% |
| Apr. | 708,200 | 28,545,906 | -17.50% | -4.50% |
| May. | 932,143 | 34,781,260 | -10.30% | 4.90% |
| Jun. | 1,004,628 | 38,683,909 | 18.50% | 16.30% |
| Total | 4,954,537 | 206,568,304 | 3.70% | 17.10% |
China’s other string musical instruments export volume reached 4955 thousand units, up 3.7% by year. The export value was USD 210 million, up 17.1 by year. In the first half of 2015, February’s export increased sharply and export value was 192.7% by year.
Major Countries for China’s other String Musical Instruments Export
| No. | Country | Volume | Value(USD) | Year-on-Year | |
| Volume | Value | ||||
| 1 | America | 1,237,651 | 64,733,630 | 23.10% | 38.50% |
| 2 | Brazil | 401,510 | 12,395,712 | 1.80% | 15.10% |
| 3 | Germany | 276,467 | 12,383,857 | 15.20% | 8.90% |
| 4 | Korea | 183,086 | 8,141,719 | 41.30% | 39.30% |
| 5 | Malaysia | 145,269 | 7,400,634 | 41.10% | 127.80% |
| 6 | England | 238,428 | 7,248,380 | -9.10% | -5.20% |
| 7 | France | 98,478 | 5,465,833 | 27.50% | 49.80% |
| 8 | Japan | 87,479 | 5,428,798 | -16.50% | -7.90% |
| 9 | Australia | 132,246 | 5,034,558 | 20.30% | 32.10% |
| 10 | Singapore | 74,792 | 4,871,892 | -1.90% | 40.60% |
| 11 | Thailand | 78,821 | 4,375,882 | 46.50% | 104.40% |
| 12 | Netherland | 91,996 | 4,298,339 | -27.60% | -32.60% |
| 13 | Canada | 85,634 | 3,921,276 | -8.20% | 7.30% |
| 14 | Italy | 113,834 | 3,610,312 | -0.80% | 17.40% |
| 15 | India | 95,480 | 3,593,064 | 24.80% | 21.30% |
| 16 | Turkey | 152,650 | 3,139,103 | 39.20% | 32.30% |
| 17 | Indonesia | 66,230 | 2,983,414 | -5.10% | 25.50% |
| 18 | Chile | 96,776 | 2,796,382 | 57.10% | 39% |
| 19 | Iran | 64,252 | 2,627,244 | -57.80% | -55.30% |
| 20 | Belgium | 82,761 | 2,483,816 | 66.50% | 65.30% |
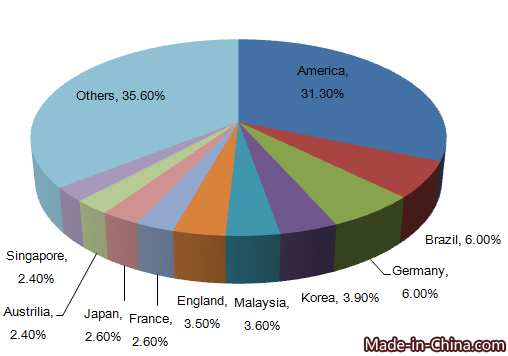
According to the export data, America, Brazil, Germany, Malaysia and England are the major countries for China’s other string musical instruments export. America topped the list, followed by Brazil and Germany. In the top 20 list, China’s export to Malaysia grew the fastest, up 127.8% in the first half of 2015.
China’s Other String Musical Instruments Export Origins
| No. | District | Volume | Value(USD) | Year-on-Year | |
| Volume | Value | ||||
| 1 | Guangdong | 2,525,777 | 105,635,342 | 8.40% | 37.20% |
| 2 | Jiangsu | 800,348 | 22,250,639 | 2.50% | 1.20% |
| 3 | Beijing | 143,868 | 15,413,975 | 0.90% | 8.70% |
| 4 | Zhejiang | 456,784 | 12,583,815 | -4.70% | 48.40% |
| 5 | Liaoning | 114,632 | 12,168,724 | -32.30% | -30.40% |
| 6 | Fujian | 342,820 | 9,506,474 | 11.50% | 6.30% |
| 7 | Tianjin | 168,397 | 8,918,048 | -7.40% | 47.60% |
| 8 | Shanghai | 87,800 | 8,134,455 | -34.20% | -31.90% |
| 9 | Shandong | 89,021 | 4,149,043 | 78.70% | 43.30% |
| 10 | Hebei | 106,038 | 2,278,006 | 10.70% | 2% |
Guangdong and Jiangsu are major origins for China’s other musical instrument export. In the first half of 2015, the two provinces’ export volume made up 61.9% and export value 67.1% of the total.


