Annual Trend of China's Cotton Export Value from 2012 to 2015
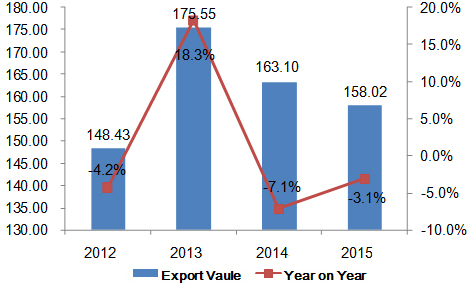
From 2012 to 2015, China's cotton export value trended down. The export value in 2015 was USD 15,802,000,000, falling 6.5% from 2014.
Monthly Trend of China's Cotton Export Value from 2012 to 2015
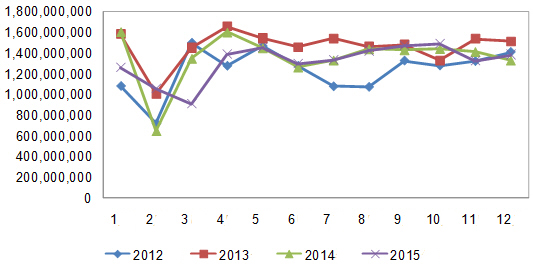
The distribution of China's silk export value peaks were dispersal during the period from 2012 to 2015. In 2015, the export value peaked in October and hit a trough in March.
China's Cotton Export Volume & Value in 2015
| Month | Volume | Value(USD) | on Year | |
| Volume | Value | |||
| January | 692,918,985 | 1,261,071,676 | -20.30% | -21.50% |
| February | 583,750,660 | 1,057,191,942 | 83.30% | 63.60% |
| March | 473,928,102 | 909,752,050 | -33.50% | -32.50% |
| April | 756,002,172 | 1,388,411,637 | -11.50% | -13.30% |
| May | 793,299,990 | 1,458,591,815 | 0.10% | 0.60% |
| June | 693,230,992 | 1,295,841,621 | -0.90% | 2.50% |
| July | 732,069,213 | 1,334,254,093 | 2.70% | 0.20% |
| August | 786,635,941 | 1,422,598,943 | -0.20% | -1.20% |
| September | 819,108,370 | 1,473,965,042 | 7.40% | 3% |
| October | 847,594,666 | 1,491,299,668 | 6.50% | 3.30% |
| November | 728,592,859 | 1,323,952,299 | -7.90% | -6.40% |
| December | 775,519,120 | 1,384,671,918 | 6% | 4.10% |
| Total | 8,682,651,070 | 15,801,602,704 | -1.60% | -3.10% |
China's cotton export value reached USD 115,802,000,000 in 2015, falling 3.1% on year.
Top Destinations for China's Cotton in 2015
| No. | Country/Region | Volume | Value | On Year | |
| Volume | Value | ||||
| 1 | Bangladesh | 1,056,332,171 | 2,256,135,462 | 8.40% | 5.10% |
| 2 | Vietnam | 871,605,751 | 2,000,126,950 | -23.50% | -16% |
| 3 | Hong Kong | 540,571,124 | 1,653,029,668 | -21.60% | -18.60% |
| 4 | Philippines | 505,523,801 | 838,763,978 | 93.90% | 84.20% |
| 5 | Benin | 497,728,625 | 590,068,662 | -23.70% | -30.80% |
| 6 | Nigeria | 321,896,775 | 579,614,101 | 138.40% | 213.60% |
| 7 | Indonesia | 244,026,970 | 564,169,268 | -10.50% | -13.50% |
| 8 | Cambodia | 170,660,068 | 397,939,258 | 8.50% | 2.90% |
| 9 | Togo | 344,467,136 | 384,169,405 | -27.90% | -35% |
| 10 | Malaysia | 143,618,038 | 383,213,968 | 20% | 16.80% |
| 11 | Pakistan | 171,407,832 | 370,644,961 | 123.50% | 100.20% |
| 12 | United States | 258,864,472 | 351,666,997 | 25.70% | 27.70% |
| 13 | Korea | 170,267,976 | 346,167,608 | -13.50% | -7.20% |
| 14 | Kyrgyzstan | 191,463,370 | 315,948,670 | -16.40% | -17.10% |
| 15 | Thailand | 178,790,832 | 269,957,684 | -4.30% | 9.50% |
| 16 | Mexico | 147,344,762 | 261,244,572 | -0.80% | -3.60% |
| 17 | Sri Lanka | 117,050,924 | 242,876,994 | -6.10% | -1.10% |
| 18 | Egypt | 97,970,563 | 219,948,202 | 25.50% | 19.50% |
| 19 | India | 81,211,407 | 193,226,307 | -7.70% | -11.90% |
| 20 | Italy | 77,942,536 | 188,723,106 | -17.90% | -25.50% |
Major markets for China's cotton export included Bangladesh, Vietnam, Hong Kong, Philippines, Benin, Nigeria, Indonesia, Cambodia, Togo, Malaysia etc in 2015.
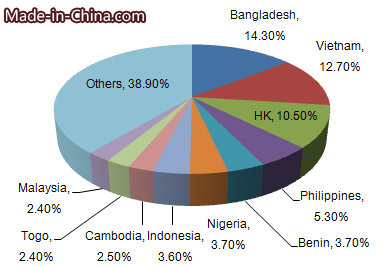
Bangladesh, Vietnam and Hong Kong were major markets for China's cotton export. In the top 20 markets, the exports to Nigeria grew 213.6% on year.
China's Cotton Export Origins in 2015
| No. | District | Volume | Value(USD) | Y-o-Y | |
| Volume | Value | ||||
| 1 | Jiangsu | 1,888,240,951 | 3,623,710,503 | 1% | -1.70% |
| 2 | Zhejiang | 1,822,642,277 | 3,420,037,452 | -6.40% | -6.90% |
| 3 | Shandong | 2,180,515,526 | 3,127,216,796 | -12.80% | -19.20% |
| 4 | Guangdong | 802,597,657 | 2,203,798,095 | 4.70% | 6.90% |
| 5 | Hebei | 384,722,579 | 692,579,184 | 50.80% | 40.80% |
| 6 | Fujian | 308,274,295 | 684,796,164 | 118.30% | 109.60% |
| 7 | Henan | 232,956,248 | 412,607,314 | 10.40% | 13.10% |
| 8 | Shanghai | 214,111,899 | 384,963,167 | -5.40% | -6.60% |
| 9 | Jiangsu | 116,876,800 | 229,320,871 | 25.50% | 45.70% |
| 10 | Hubei | 295,054,191 | 216,521,881 | 0.40% | -20.30% |
| 11 | Anhui | 92,160,382 | 203,035,353 | 2.30% | -0.80% |
| 12 | Sichuan | 72,582,976 | 97,082,945 | -9% | -11.80% |
| 13 | Shanxi | 42,625,523 | 79,294,955 | -12.40% | -21.10% |
| 14 | Shaanxi | 63,976,215 | 73,980,666 | -9.40% | -5.50% |
| 15 | Tianjin | 30,553,954 | 71,431,329 | -21.50% | -16.20% |
| 16 | Chongqing | 33,749,603 | 61,672,252 | -36.60% | -24% |
| 17 | Hunan | 25,799,926 | 58,036,755 | -28.40% | -34.10% |
| 18 | Yunnan | 30,676,100 | 54,093,286 | -22% | -24.90% |
| 19 | Liaoning | 13,464,470 | 36,182,019 | -18.30% | -17.20% |
| 20 | Xinjiang | 9,592,429 | 30,448,594 | -52.90% | -52.80% |
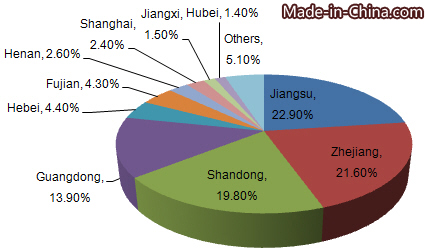
Zhejiang, Shandong and Jiangsu were China's major cotton export origins. In 2015, their cotton export value accounted for 67.9% of China's total. In China's top 20 export origins, Fujian's cotton export value grew 109.6% on year.


