China Keyboard Instruments Export Volume & Value
| Month | Volume | Value(USD) | Y-o-Y | |
| Volume | Value | |||
| Jan. | 478,147 | 41,670,353 | -12% | 9.90% |
| Feb. | 396,076 | 31,968,022 | 35.70% | 24.60% |
| Mar. | 327,786 | 27,729,817 | -20.30% | -12.10% |
| Apr. | 486,315 | 38,164,057 | -14.50% | -4.80% |
| May | 688,104 | 40,563,518 | 18.90% | -9.10% |
| Jun. | 534,952 | 43,735,519 | -13.40% | -2.40% |
| Total | 2,911,380 | 223,831,286 | -3.30% | -0.40% |
From January to June in 2015, China keyboard instruments export value reached USD 220 million, down 0.4% by year, while the export volume reached 2.9 million, down 3.3% by year.
Major Regions for China's Keyboard Instruments Export
| No. | Country/Region | Volume | Value(USD) | Y-o-Y | |
| Volume | Value | ||||
| 1 | America | 705,966 | 67,615,944 | -0.60% | 15.40% |
| 2 | Japan | 207,800 | 24,476,878 | -12% | -8.40% |
| 3 | Germany | 281,020 | 24,259,455 | 2.80% | -2.50% |
| 4 | Netherlands | 87,746 | 11,303,069 | -12.40% | 17.50% |
| 5 | Hong Kong | 173,726 | 9,611,594 | -21.20% | -31.20% |
| 6 | Korea | 68,545 | 8,681,524 | 0.60% | 20.80% |
| 7 | England | 111,326 | 8,524,386 | -15.90% | -8.70% |
| 8 | France | 79,708 | 7,498,385 | 13.90% | 18.40% |
| 9 | India | 137,948 | 5,438,168 | 2.10% | 5.70% |
| 10 | Brazil | 96,904 | 5,423,050 | -14.80% | -13.10% |
| 11 | Australia | 63,835 | 5,084,384 | -7.50% | 32.80% |
| 12 | UAE | 58,042 | 4,341,149 | -51.30% | -45.40% |
| 13 | Canada | 30,311 | 3,531,562 | 4.70% | -2.80% |
| 14 | Singapore | 31,488 | 3,468,574 | 18.50% | 89.70% |
| 15 | Mexico | 239,570 | 3,126,190 | 462.60% | 14.70% |
| 16 | Malaysia | 50,570 | 2,959,370 | 38% | 49.30% |
| 17 | Argentina | 28,177 | 1,927,955 | 18.80% | 25.20% |
| 18 | Italy | 20,225 | 1,842,507 | -45.10% | -3% |
| 19 | South Africa | 24,154 | 1,520,553 | 37.40% | 30.80% |
| 20 | Russia | 15,865 | 1,474,524 | -49.70% | -52.20% |
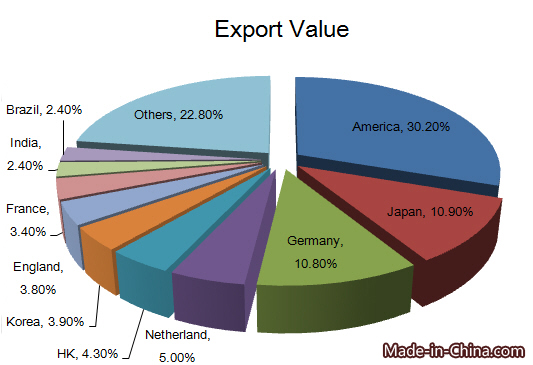
From January to June in 2015, the export data shows that America, Japan, Germany, Netherlands, Hong Kong, Korea, England, France, India and Brazil topped the country list for China's keyboard instruments export. America is the largest export market for China's keyboard instruments, followed by Japan and Germany. The export value to these three countries accounted for 30.2%, 10.9%, and 10.8% of China's keyboard instruments total export value respectively.
From January to June in 2015, in the top 20 export markets, the export value to Singapore grew fastest, 89.7% higher than that in 2014.
Distribution of China's Keyboard Instruments Origins
| No. | Region | Volume | Value(USD) | Y-o-Y | |
| Volume | Value | ||||
| 1 | Guangdong | 1,374,754 | 93,643,079 | -13% | -3.50% |
| 2 | Tianjin | 455,946 | 45,972,154 | -8.90% | -2.50% |
| 3 | Jiangsu | 439,374 | 27,486,415 | 108.10% | 28.10% |
| 4 | Shandong | 219,319 | 22,521,670 | 1.40% | 18.20% |
| 5 | Shanghai | 127,401 | 17,890,886 | -5% | -4.20% |
| 6 | Zhejiang | 199,795 | 8,928,397 | -16.70% | -30.90% |
| 7 | Fujian | 46,662 | 3,281,959 | -16.70% | -13.90% |
| 8 | Heilongjiang | 6,165 | 1,263,899 | -14.10% | 6% |
| 9 | Beijing | 1,962 | 662,700 | -84.20% | -14.60% |
| 10 | Liaoning | 5,019 | 429,324 | 10.20% | -20.30% |
Guangdong, Tianjin and Jiangsu are the major origins for China's keyboard instruments export. From January to June in 2015, the above three provinces' total export volume accounted for 78% of China's keyboard instruments total export, while the total export value accounted for 74.7% of the total.
From January to June in 2015, in the top 10 supply source, Jiangsu's export volume grew fastest, up 108.1% by year.


