Distribution of China's Fertilizers Export Enterprises
| No. | Region | Export Value | Y-o-Y | ||
| Volume(kg) | Value(USD) | Volume | Value | ||
| 1 | Shandong | 8,019,737,276 | 2,130,632,954 | -21.90% | -27.10% |
| 2 | Yunnan | 4,852,743,684 | 1,947,028,841 | 70.30% | 80.60% |
| 3 | Hubei | 4,242,459,948 | 1,775,940,198 | 62.70% | 72.30% |
| 4 | Guizhou | 3,018,849,590 | 1,161,152,335 | 26.60% | 28.90% |
| 5 | Inner Mongolia | 2,235,926,630 | 634,253,729 | 33.50% | 32.70% |
| 6 | Hebei | 2,143,791,830 | 532,959,198 | 138.20% | 184.60% |
| 7 | Jiangsu | 2,104,321,313 | 438,957,941 | 15.20% | 15.10% |
| 8 | Shanxi | 1,482,830,796 | 403,012,874 | 72% | 56.70% |
| 9 | Anhui | 795,814,453 | 234,882,461 | 88.90% | 97.40% |
| 10 | Chongqing | 657,114,847 | 232,507,147 | -22.90% | -20.60% |
From January to December, Shandong, Yunnan and Hubei were the main regions where China's fertilizers export enterprise located. The three provinces' total export value accounted for 53.8% of China's total.
Major Countries/Regions for China Fertilizers Export
| No. | Country/Region | Export Value | Y-o-Y | ||
| Volume(kg) | Value(USD) | Volume | Value | ||
| 1 | India | 10,184,358,379 | 3,538,015,502 | 39.80% | 51.30% |
| 2 | Brazil | 2,518,846,999 | 809,561,770 | 47.10% | 43.10% |
| 3 | America | 2,250,363,144 | 698,103,569 | 15.90% | 12.20% |
| 4 | Vietnam | 2,260,954,958 | 672,887,453 | 28.50% | 32.30% |
| 5 | Indonesia | 2,480,377,781 | 556,653,662 | 70.80% | 62.50% |
| 6 | Pakistan | 1,068,608,152 | 406,002,935 | -21.20% | -20.40% |
| 7 | Australia | 1,063,697,305 | 348,632,453 | 25.50% | 29.40% |
| 8 | Mexico | 1,092,048,418 | 332,075,558 | -2.50% | 3.40% |
| 9 | Philippines | 1,175,195,215 | 304,233,566 | -8% | -6% |
| 10 | Thailand | 807,683,165 | 297,005,693 | 6.40% | 23.70% |
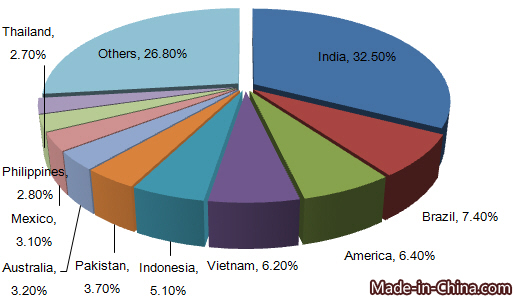
From Jan. to Dec. in 2015, India, Brazil, America, Vietnam, Indonesia, Pakistan, Australia, Mexico, Philippines and Thailand were major countries for China's fertilizers export, among of which, India topped the list of the export value. The export value to India accounted for 32.5% of China's fertilizers total export value from January to December in 2015.
Major Countries/Regions in need of Fertilizers from Jan. to Sep. in 2015
| Importing Country/Region | Import Value(USD) | Y-o-Y |
| America | 6,696,270,000 | 4.50% |
| India | 5,924,759,000 | 79.80% |
| Brazil | 4,794,088,000 | -19.70% |
| China | 2,670,493,000 | 9.90% |
| France | 1,762,820,000 | -18.30% |
From January to September in 2015, major fertilizers importing countries were America, India, Brazil, China and France. As the largest importing country, America's import value was USD 6696 million. China was the fourth largest import country, with the export value of USD 2.67 billion from Jan. to Sep. in 2015.
Major Fertilizers Exporting Countries from Jan. to Sep. in 2015
| Exporting Country/Region | Export Value(USD) | Y-o-Y |
| China | 7,950,462,000 | 43.60% |
| Russia Federation | 6,806,341,000 | 1.90% |
| Canada | 4,908,296,000 | 19.70% |
| America | 3,480,469,000 | -1.20% |
| Germany | 2,137,822,000 | -6.40% |
From January to September in 2015, major fertilizers exporting countries included China, Russia Federation, Canada, America and Germany. China was the largest export country with the export value of USD 7.95 billion.


