China Musical Boxes, Decoy Call, Musical Inst Export Volume & Value
| Month | Volume | Value(USD) | Y-o-Y | |
| Volume | Value | |||
| Jan. | 7,702,450 | 7,786,269 | -16.40% | 16.50% |
| Feb. | 8,420,349 | 8,367,105 | 53.10% | 176.60% |
| Mar. | 4,738,416 | 2,687,560 | -50.20% | -50.60% |
| Apr. | 21,769,655 | 7,034,112 | 6.10% | 26.50% |
| May | 19,040,906 | 8,157,003 | -27.60% | 41.30% |
| Jun. | 11,445,255 | 8,195,640 | 6.60% | 25.80% |
| Total | 73,117,031 | 42,227,689 | -10.60% | 28.00% |
From January to June in 2015, China musical boxes, decoy call, musical inst export value reached USD 42.2 million, up 28% by year, while the export volume reached 73 million, down 10.6% by year.
From January to June in 2015, the export volume and value in February all has a remarkable growth by year. The export volume grew by 53.1% and the export value grew by 176.6%.
Major Regions for China’s Musical Boxes, Decoy Call, Musical Inst Export
| No. | Country/Region | Volume | Value(USD) | Y-o-Y | |
| Volume | Value | ||||
| 1 | America | 10,697,165 | 6,930,431 | 23.60% | 77.70% |
| 2 | Malaysia | 1,417,215 | 1,851,470 | -33.80% | 53% |
| 3 | Hong Kong | 3,273,646 | 1,817,155 | 30.90% | -11.20% |
| 4 | England | 1,784,722 | 1,498,807 | -9.90% | 50.40% |
| 5 | Mexico | 13,378,844 | 1,437,509 | 1121.10% | 158.50% |
| 6 | Brazil | 688,750 | 1,419,786 | -73.80% | -41.80% |
| 7 | Korea | 900,521 | 1,354,068 | 135% | 118.90% |
| 8 | Chile | 990,206 | 1,243,547 | 21.80% | 103.80% |
| 9 | Iran | 691,181 | 1,177,493 | -50.10% | -14.20% |
| 10 | Taiwan | 340,723 | 1,134,576 | 34.10% | 64.70% |
| 11 | Singapore | 431,809 | 1,041,556 | 8.90% | 82.10% |
| 12 | Pakistan | 15,971,326 | 1,032,719 | 550% | 76.20% |
| 13 | Japan | 1,771,777 | 959,210 | -6.30% | -16.60% |
| 14 | Philippines | 903,107 | 911,291 | 61% | 335.10% |
| 15 | Germany | 1,205,277 | 909,238 | -45.90% | -2.70% |
| 16 | Italy | 823,541 | 862,149 | 16.20% | 51.80% |
| 17 | UAE | 886,022 | 831,288 | -49.10% | -39.50% |
| 18 | Spain | 957,061 | 828,686 | -53% | -54.30% |
| 19 | Iraq | 767,457 | 824,723 | -28.70% | 100.50% |
| 20 | Netherlands | 646,062 | 735,770 | -85.50% | -58.60% |
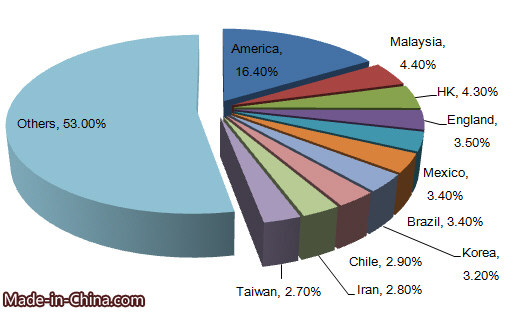
From January to June in 2015, the export data shows that America, Malaysia, Hong Kong, England, Mexico, Brazil, Korea, Chile, Iran and Taiwan topped the country list for China’s musical boxes, decoy call, musical inst export. America is the largest export market for China’s musical boxes, decoy call, musical inst, followed by Malaysia and Hong Kong. The export value to these three countries accounted for 16.4%, 4.4%, and 4.3% of China’s musical boxes, decoy call, musical inst total export value respectively.
From January to June in 2015, in the top 20 export markets, the export value to Philippines grew fastest, 335.1% higher than that in 2014.
Distribution of China’s Musical Boxes, Decoy Call, Musical Inst Origins
| No. | Region | Volume | Value(USD) | Y-o-Y | |
| Volume | Value | ||||
| 1 | Zhejiang | 44,470,440 | 22,863,915 | 25.20% | 68.80% |
| 2 | Guangdong | 24,806,669 | 14,907,774 | -37.70% | 0.80% |
| 3 | Fujian | 520,668 | 1,454,088 | 2.80% | 87.70% |
| 4 | Jiangsu | 655,017 | 700,180 | -38.10% | -29.90% |
| 5 | Shanghai | 892,504 | 597,537 | -65.30% | -43.80% |
| 6 | Jiangxi | 469,637 | 412,347 | 114.10% | 16.60% |
| 7 | Tianjin | 256,986 | 352,761 | -21.60% | -18.90% |
| 8 | Hubei | 6,324 | 160,280 | -65.40% | 453.80% |
| 9 | Guizhou | 39,193 | 153,096 | -57.80% | -26% |
| 10 | Hunan | 11,513 | 118,384 | -70.10% | 97.30% |
Zhejiang and Guangdong are the major origins for China’s musical boxes, decoy call, musical inst export. From January to June in 2015, the above two provinces’ total export volume accounted for 94.7% of China’s musical boxes, decoy call, musical inst total export, while the total export value accounted for 89.4% of the total.
From January to June in 2015, in the top 10 supply source, Hubei’s export value grew fastest, up 453.8% by year.


