Distribution of China's Rubber and Articles Thereof Export Enterprises
| No. | District | Export Value | Y-o-Y | ||
| Volume(kg) | Value(USD) | Volume | Value | ||
| 1 | Shandong | 3,498,599,140 | 8,226,801,364 | -4.40% | -17.20% |
| 2 | Zhejiang | 733,421,280 | 2,338,919,380 | -7.10% | -11.70% |
| 3 | Jiangsu | 654,517,709 | 2,285,307,516 | -7.50% | -14.50% |
| 4 | Guangdong | 425,717,021 | 1,842,438,290 | -0.90% | -9.50% |
| 5 | Shanghai | 214,748,712 | 858,719,784 | -11.20% | -15.90% |
| 6 | Fujian | 198,689,525 | 689,417,896 | -10.50% | -17.50% |
| 7 | Liaoning | 214,268,268 | 672,506,871 | 23.10% | 10.60% |
| 8 | Henan | 229,439,775 | 574,584,342 | -11.80% | -21.10% |
| 9 | Tianjin | 157,234,339 | 522,251,178 | 4.70% | -2.20% |
| 10 | Anhui | 132,334,352 | 483,981,383 | 1.70% | -7.40% |
From January to December, Shandong, Zhejiang and Jiangsu were the main regions where China's rubber and articles export enterprises located. Shandong's export value accounted for 40.4% of the total.
Major Countries/Regions for China Rubber and Articles Export
| No. | Country/Region | Export Value | Y-o-Y | ||
| Volume(kg) | Value(USD) | Volume | Value | ||
| 1 | America | 1,305,983,282 | 3,963,952,079 | -18% | -23.60% |
| 2 | Mexico | 274,029,013 | 745,815,420 | 11.20% | 1.40% |
| 3 | England | 262,232,966 | 739,966,899 | -0.70% | -13.80% |
| 4 | Japan | 138,731,124 | 657,935,681 | 2.20% | -7.30% |
| 5 | Australia | 207,447,960 | 600,089,642 | 3.40% | -8% |
| 6 | Germany | 154,515,071 | 545,457,321 | 1.70% | -11.50% |
| 7 | UAE | 237,553,522 | 542,977,440 | -2.30% | -17.50% |
| 8 | Saudi Arabia | 234,387,801 | 509,452,082 | 14.20% | -4.20% |
| 9 | Canada | 170,536,288 | 489,215,279 | 4.40% | -7% |
| 10 | Korea | 112,636,092 | 377,894,559 | 3.90% | 1.20% |
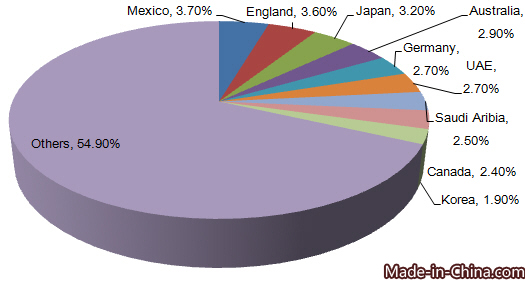
From Jan. to Dec. in 2015, America, Mexico, England, Japan, Australia, Germany, UAE, Saudi Arabia, Canada and Korea were major countries for China's rubber and articles export. America topped the list of the export value. The export value to America accounted for 19.5% of China's rubber and articles total export value from January to December in 2015.
Major Countries/Regions in Need of Rubber and Articles
| Importing Country/Region | Import Value(USD) | Y-o-Y |
| America | 21,441,361,000 | -2.90% |
| Germany | 11,236,812,000 | -18.90% |
| China | 10,680,609,000 | -19.10% |
| France | 5,098,374,000 | -16.50% |
| Mexico | 4,975,124,000 | -0.90% |
From January to September in 2015, major rubber and articles importing countries were America, Germany, China, France and Mexico. As the largest importing country, America's import value was USD 21441 million. China ranked third with the import value of USD 10681 million.
Major Rubber and Articles Exporting Countries
| Exporting Country/Region | Export Value(USD) | Y-o-Y |
| China | 15,427,801,000 | -13.70% |
| Germany | 11,886,368,000 | -16.70% |
| America | 10,388,789,000 | -8.10% |
| Thailand | 9,280,702,000 | -14.30% |
| Japan | 7,818,628,000 | -16.10% |
From January to September in 2015, major rubber and articles exporting countries included China, Germany, America, Thailand and Japan. China was the largest export country with the export value of USD 15428 million.


