Distribution of China's Demonstrational Instruments Export Enterprises from Jan. to Dec. in 2015
| No | District | Total | Y-o-Y | ||
| Volume(kg) | Value(USD) | Volume | Value | ||
| 1 | Guangdong | 13,326,475 | 293,704,688 | -48.10% | -22.60% |
| 2 | Henan | 1,832,427 | 116,454,764 | 54.10% | 184.50% |
| 3 | Shandong | 1,385,746 | 59,406,542 | 0.70% | 22.40% |
| 4 | Jiangsu | 1,706,843 | 33,920,152 | -5.70% | -21.20% |
| 5 | Shanghai | 1,179,208 | 25,182,950 | -29.10% | 16.90% |
| 6 | Zhejiang | 2,710,241 | 23,268,120 | 2.10% | -0.90% |
| 7 | Hunan | 231,548 | 16,231,501 | -26.20% | 230.10% |
| 8 | Sichuan | 818,947 | 11,898,443 | 48.30% | 14.30% |
| 9 | Beijing | 127,267 | 6,216,850 | -45.90% | -37.80% |
| 10 | Fujian | 165,833 | 4,613,216 | -65.20% | -48.10% |
From January to December, Guangdong, Henan and Shandong were the main regions where China's demonstrational instruments export enterprises located. Guangdong's export value accounted for 48.4% of the total, down 22.6% by year.
Major Countries/Regions for China's Demonstrational Instruments Export
| No. | Country/Region | Total | Y-o-Y | ||
| Volume(kg) | Value(USD) | Volume | Value | ||
| 1 | Hong Kong | 5,206,989 | 133,417,335 | -59.10% | -3.60% |
| 2 | America | 4,962,391 | 117,554,247 | 3.60% | 43.80% |
| 3 | Japan | 1,761,545 | 63,988,828 | -2.40% | -4% |
| 4 | Korea | 614,043 | 23,340,748 | 20.20% | 69.80% |
| 5 | Germany | 975,939 | 19,134,976 | -27.40% | -29.20% |
| 6 | Netherlands | 675,246 | 15,340,760 | -2.70% | 2.80% |
| 7 | Malaysia | 564,996 | 14,541,928 | -1.70% | 44.20% |
| 8 | England | 557,783 | 13,039,922 | -1.70% | 3.70% |
| 9 | Indonesia | 453,411 | 11,932,461 | -4.60% | -11.20% |
| 10 | Singapore | 478,549 | 11,433,438 | -44% | -24.40% |
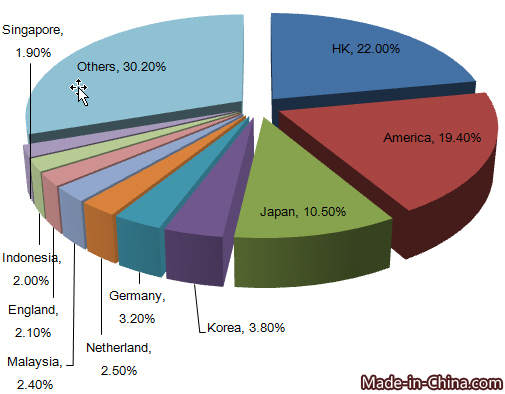
From Jan. to Dec. in 2015, Hong Kong, America, Japan, Korea, Germany, Netherlands, Malaysia, England, Indonesia and Singapore were major countries for China's demonstrational instruments export. Hong Kong topped the lis. From January to December in 2015, the export value to Hong Kong accounted for 22% of China's demonstrational instruments total export value.
Major Countries/Regions in need of Demonstrational instruments from Jan. to Sep. in 2015
| Importing Country/Region | Import Value(USD) | Y-o-Y |
| America | 389,029,000 | 4.50% |
| China | 114,638,000 | -1.10% |
| Japan | 111,016,000 | -15.80% |
| Canada | 79,809,000 | 5.60% |
| Germany | 58,119,000 | -10.90% |
From January to September in 2015, major demonstrational instruments importing countries were America, China, Japan, Canada and Germany. As the largest importing country, America's import value was USD 389 million. China ranked second and the import value was USD 115 million in the first three quarters of 2015.
Major Demonstrational instruments Exporting Countries from Jan. to Sep. in 2015
| Exporting Country/Region | Export Value(USD) | Y-o-Y |
| China | 412,525,000 | -9.30% |
| America | 454,931,000 | 4.10% |
| Germany | 253,145,000 | -3.40% |
| England | 112,594,000 | -8.60% |
| Norway | 80,247,000 | 24.40% |
From January to September in 2015, major demonstrational instruments exporting countries included China, America, Germany, England and Norway. As the largest export country, China's export value was USD 413 million.

")

")
")
")