China’s Iron & Steel Export Volume & Value in 2015
| Month | Volume(kg) | Value(USD) | on Year | |
| Volume | Value | |||
| January | 9,182,152,021 | 5,466,142,434 | 62.70% | 34.30% |
| February | 6,705,767,374 | 3,959,285,317 | 57.90% | 34.20% |
| March | 6,877,635,665 | 3,844,821,717 | 15.90% | -7.80% |
| April | 7,572,287,404 | 4,136,168,596 | 16.70% | -11.80% |
| May | 8,176,434,884 | 4,185,406,634 | 17.50% | -15.10% |
| June | 7,897,684,827 | 3,975,927,812 | 27.40% | -9.60% |
| July | 8,760,270,887 | 4,227,532,847 | 23.20% | -15.20% |
| August | 8,846,866,338 | 4,112,919,445 | 30.50% | -12.70% |
| September | 10,149,151,720 | 4,481,490,854 | 35.60% | -10.50% |
| October | 7,904,446,199 | 3,506,747,202 | 3.30% | -29% |
| November | 8,660,755,248 | 3,573,187,950 | 0% | -32.40% |
| December | 9,634,176,743 | 3,749,255,114 | 8% | -29.90% |
| Total | 100,367,629,310 | 49,218,885,922 | 22.30% | -11.30% |
China’s iron & steel export value reached USD 49,219,000,000 in 2015, falling 11.3% on year.
Destinations for China’s Iron & Steel
| No. | Country/Region | Volume(kg) | Value(USD) | on Year | |
| Volume | Value | ||||
| 1 | Korea | 13,090,413,373 | 6,332,014,945 | 3% | -24.10% |
| 2 | Vietnam | 9,839,620,036 | 4,152,299,318 | 53.20% | 9.60% |
| 3 | India | 4,341,167,731 | 2,260,446,411 | 30% | -3.10% |
| 4 | Philippines | 5,235,183,176 | 2,173,137,688 | 15.30% | -15.50% |
| 5 | Thailand | 4,276,423,134 | 2,011,959,128 | 34.30% | -3% |
| 6 | Taiwan | 2,411,663,147 | 1,960,430,749 | -11.50% | -33.70% |
| 7 | Indonesia | 4,606,175,054 | 1,911,022,634 | 55.40% | 8.10% |
| 8 | United States | 1,796,616,322 | 1,494,874,379 | -35.20% | -39.90% |
| 9 | Malaysia | 3,069,980,353 | 1,444,967,682 | 38.80% | -2.70% |
| 10 | Italy | 2,611,561,372 | 1,389,642,216 | 84.40% | -0.50% |
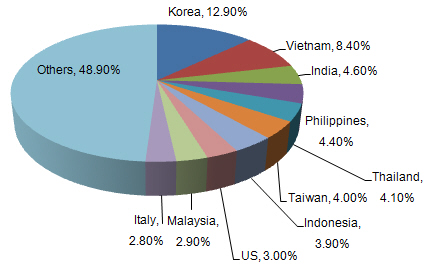
Korea was top destination for China’s iron & steel in 2015. India ranked as the third and the export from China to India in 2015 was 4,341,167,731 kg. China’s iron & steel export to Vietnam grew fast and the growth was 9.6% on 2014.
Export Origins of China’ Iron & Steel
| No. | District | Volume(kg) | Value(USD) | on Year | |
| Volume | Value | ||||
| 1 | Hebei | 34,864,431,541 | 13,520,087,336 | 37.60% | -0.80% |
| 2 | Jiangsu | 17,756,832,402 | 8,752,880,310 | 33.70% | -6% |
| 3 | Liaoning | 13,114,881,098 | 5,342,270,247 | 11.30% | -20.60% |
| 4 | Shandong | 11,368,357,130 | 5,266,534,884 | 20.20% | -8.90% |
| 5 | Guangdong | 1,919,942,234 | 2,614,539,424 | -19% | -28.80% |
| 6 | Tianjin | 4,308,298,098 | 2,043,025,322 | 12.90% | -17.40% |
| 7 | Zhejiang | 2,655,189,341 | 1,876,234,854 | 34.70% | -7.60% |
| 8 | Shanghai | 2,305,650,960 | 1,851,179,349 | -8.30% | -22.80% |
| 9 | Jiangxi | 1,294,057,533 | 1,639,209,083 | 3.80% | -11.20% |
| 10 | Hubei | 1,385,513,088 | 843,942,025 | -3.20% | -17% |
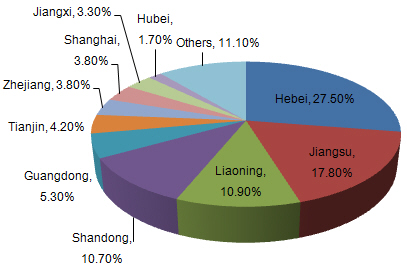
Hebei province exported USD 13,520,087,336 iron & steel in 2015, making the largest origin. Other export origins included Jiangsu province, Liaoning province, etc. Guangdong’s average export price was USD 1.36 per kg, ranking first in the top ten origins.
Source:


