Annual Trend of China's Manmade Staple Fibers Export Value
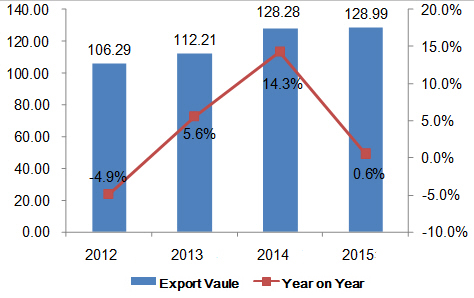
From 2012 to 2015, China's manmade staple fibers export value trended up. The export value in 2015 was USD 12,899,000,000, growing 21.4% from 2012.
Monthly Trend of China's Manmade Staple Fibers Export Value
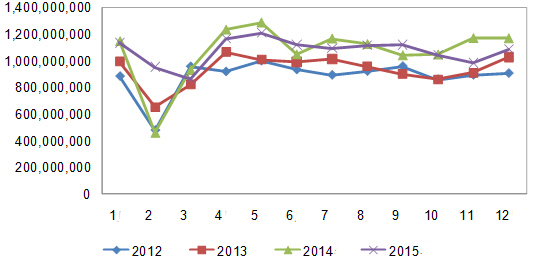
China's manmade staple fibers export value surged in May during the period from 2012 to 2015. In 2015, the export value peaked in May and hit a trough in March.
China's Manmade Staple Fibers Export Volume & Value
| Month | Volume | Value(USD) | on Year | |
| Volume | Value | |||
| Month | 788,944,974 | 1,135,322,372 | 5.20% | -0.50% |
| February | 686,858,406 | 953,667,113 | 136% | 107% |
| March | 514,058,954 | 865,559,412 | -16% | -7.10% |
| April | 750,305,118 | 1,164,847,168 | -3.80% | -5.50% |
| May | 804,064,739 | 1,209,402,194 | 1% | -6% |
| June | 749,461,379 | 1,121,211,822 | 13.30% | 7% |
| July | 750,487,533 | 1,095,269,799 | 1.80% | -6.10% |
| August | 765,235,890 | 1,117,365,308 | 1.30% | -0.70% |
| September | 782,091,631 | 1,119,935,385 | 10.50% | 7.60% |
| October | 699,143,629 | 1,046,053,556 | -2% | -0.10% |
| November | 656,208,673 | 983,980,025 | -13.10% | -15.90% |
| December | 748,917,980 | 1,086,422,221 | -5.30% | -7% |
| Total | 8,695,778,906 | 12,899,036,375 | 4.20% | 0.60% |
China's manmade staple fibers export value reached USD 12,899,000,000 in 2015, growing 0.6% on year.
Destinations for China's Manmade Staple Fibers
| No. | Country/Region | Volume | Value(USD) | on Year | |
| Volume | Value | ||||
| 1 | Vietnam | 1,162,808,972 | 2,777,483,320 | 13.50% | 22.90% |
| 2 | Bangladesh | 441,973,890 | 897,065,572 | 26.40% | 13% |
| 3 | Pakistan | 496,285,511 | 598,760,089 | -4.60% | -15.90% |
| 4 | United States | 371,775,887 | 524,430,706 | 11.60% | 3.70% |
| 5 | Indonesia | 279,926,060 | 447,460,932 | -7% | -11.20% |
| 6 | Korea | 211,275,272 | 405,720,886 | -9.50% | -3.30% |
| 7 | Hong Kong | 131,446,207 | 382,828,479 | -4.50% | -12.50% |
| 8 | United Arab Emirates | 370,494,965 | 378,183,360 | -4.80% | -9.30% |
| 9 | India | 223,087,761 | 363,181,036 | 5.20% | -9.40% |
| 10 | Brazil | 284,788,503 | 358,815,620 | 24.10% | 6.90% |
| 11 | Egypt | 198,173,921 | 339,417,417 | 16.10% | 2.70% |
| 12 | Myanmar | 320,942,355 | 281,758,172 | -3.70% | -5.70% |
| 13 | Mexico | 180,770,831 | 224,871,774 | 19.10% | 4% |
| 14 | Turkey | 153,415,758 | 221,722,934 | -17.30% | -23.30% |
| 15 | Russia | 161,304,640 | 217,078,866 | -15.30% | -23.10% |
| 16 | Iran | 109,657,392 | 211,388,237 | 19.90% | 35.80% |
| 17 | Thailand | 157,208,660 | 174,189,543 | -17.30% | -11.30% |
| 18 | Italy | 103,898,207 | 166,096,030 | -0.30% | -13.70% |
| 19 | Philippines | 118,893,197 | 159,680,064 | 21.90% | 13.70% |
| 20 | Germany | 88,695,786 | 145,246,022 | -20.80% | -22% |
Destinations for China's manmade staple fibers export included Vietnam, Bangladesh, Pakistan, India, etc in 2015. Vietnam was the largest market for China's manmade staple fibers export. China's manmade staple fibers exports to Vietnam increased in 2015 on year and it accounted for 21.5% of China's total manmade staple fibers export. From January to December in 2015, China's manmade staple fibers exports to Vietnam grew 35.8% on year.
China's Manmade Staple Fibers Export Origins in 2015
| No. | District | Volume | Value(USD) | on Year | |
| Volume | Value | ||||
| 1 | Zhejiang | 3,304,921,513 | 4,362,034,288 | 3.40% | -2.60% |
| 2 | Jiangsu | 1,841,570,610 | 2,476,400,726 | 8.20% | -1.80% |
| 3 | Guangdong | 722,056,015 | 2,276,496,147 | 176.40% | 227.30% |
| 4 | Shandong | 660,081,630 | 845,893,880 | -6.70% | -7.40% |
| 5 | Hebei | 454,518,305 | 587,852,434 | -1% | -5.30% |
| 6 | Shanghai | 355,944,732 | 487,086,541 | 12.80% | 3.50% |
| 7 | Fujian | 303,085,091 | 432,195,222 | 5.30% | -3.80% |
| 8 | Sichuan | 190,087,812 | 228,476,251 | -9.80% | -19.80% |
| 9 | Hubei | 128,881,784 | 205,790,542 | -8.20% | -14.70% |
| 10 | Anhui | 105,915,300 | 181,422,674 | -0.90% | -7.20% |
| 11 | Henan | 141,493,533 | 148,196,145 | -4.70% | -12.40% |
| 12 | Liaoning | 69,170,827 | 139,511,412 | -11.40% | -12.20% |
| 13 | Jiangxi | 71,298,760 | 137,893,490 | 0.80% | 3.60% |
| 14 | Shaanxi | 138,163,528 | 101,885,502 | 4.30% | -12.20% |
| 15 | Guilin | 29,088,342 | 55,827,994 | -8.60% | -21% |
| 16 | Beijing | 32,160,249 | 54,301,768 | 9.50% | 7.30% |
| 17 | Chongqing | 69,402,672 | 50,309,185 | -19.80% | -20.10% |
| 18 | Xinjiang | 17,748,057 | 32,297,679 | -35.60% | -26.50% |
| 19 | Tianjin | 18,138,829 | 26,496,782 | 26.70% | 12.80% |
| 20 | Hunan | 17,861,615 | 15,210,101 | -38.10% | -36.90% |
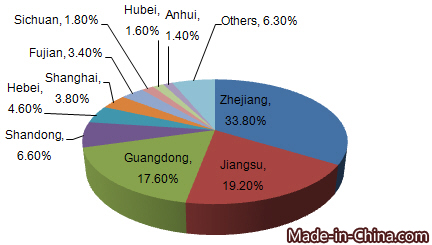
Zhejiang province ,Jiangsu province and Guangdong province were China's major manmade staple fibers export origins. In 2015, their manmade staple fibers export value accounted for 67.5% of China's total.
In China's top 20 export origins, Gaungdong's manmade staple fibers export value grew 227.3% on year. Guangdong owned the highest export price (USD 3.15 per) and Chongqing owned the lowest (USD 0.72 per)


