Annual Trend of China's Special Woven or Tufted Fabric Export Value from 2012 to 2015
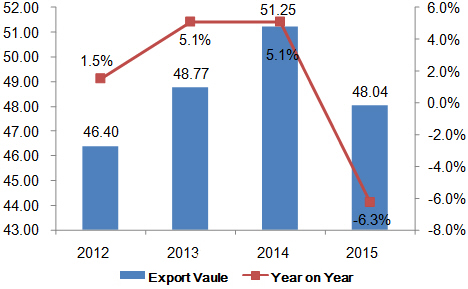
From 2012 to 2015, China's special woven or tufted fabric export value trended up. The export value in 2015 was USD 4,804,000,000, growing 5.3% from 2012.
Monthly Trend of China's Special Woven or Tufted Fabric Export Value from 2012 to 2015
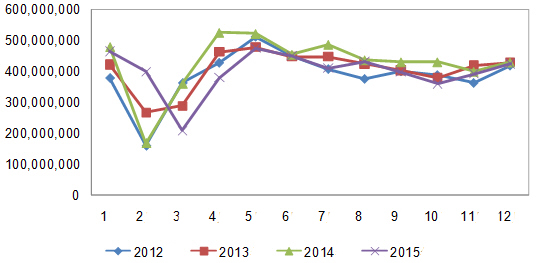
China's special woven or tufted fabric export value surged in the second quarter during the period from 2012 to 2015. In 2015, the export value peaked in May and hit a trough in March.
China's Special Woven or Tufted Fabric Export Volume & Value in 2015
| Month | Volume | Value(USD) | on Year | |
| Volume | Value | |||
| January | 92,672,749 | 464,925,461 | -16.50% | -3.10% |
| February | 76,318,795 | 399,774,765 | 190.10% | 137.40% |
| March | 37,118,810 | 210,270,301 | -48.70% | -41.60% |
| April | 73,131,811 | 380,407,821 | -32.60% | -27.60% |
| May | 105,984,681 | 475,128,175 | 5.90% | -9% |
| June | 90,244,909 | 450,575,364 | -2.90% | -0.90% |
| July | 95,940,960 | 411,036,194 | -8.50% | -15.60% |
| August | 83,141,786 | 433,055,700 | -14.40% | -0.90% |
| September | 80,355,579 | 399,465,733 | -9.30% | -7.10% |
| October | 68,755,868 | 360,493,916 | -10.80% | -16.20% |
| November | 75,061,810 | 393,120,776 | -14% | -1.40% |
| December | 82,988,160 | 425,696,737 | 3.40% | -0.90% |
| Total | 961,715,918 | 4,803,950,943 | -8.10% | -6.20% |
China's special woven or tufted fabric export value reached USD 4,804,000,000 in 2015, falling 6.2% on year.
Destinations for China's Special Woven or Tufted Fabric in 2015
| No. | Country/Region | Volume | Value(USD) | on Year | |
| Volume | Value | ||||
| 1 | Hong Kong | 44,886,279 | 552,590,412 | -12.30% | 2% |
| 2 | United States | 73,735,104 | 409,921,628 | -16.20% | -3.20% |
| 3 | Vietnam | 63,117,780 | 324,053,075 | 37.60% | -1.50% |
| 4 | United Arab Emirates | 42,048,360 | 227,091,813 | -32.90% | -30.40% |
| 5 | Bangladesh | 53,678,928 | 225,856,349 | -1.90% | -0.50% |
| 6 | Philippines | 29,443,661 | 220,678,890 | 15% | 29.80% |
| 7 | Nigeria | 20,364,811 | 185,304,819 | -11.90% | -13.20% |
| 8 | India | 24,396,763 | 143,254,018 | 2.10% | 9.30% |
| 9 | Indonesia | 16,551,072 | 137,746,103 | -14.30% | -11.50% |
| 10 | Brazil | 15,299,840 | 129,812,551 | -22.20% | -22.30% |
| 11 | Iran | 42,584,735 | 118,392,869 | 13% | 0.90% |
| 12 | Turkey | 14,748,775 | 113,885,161 | -25.50% | -27.80% |
| 13 | Pakistan | 33,167,578 | 106,236,807 | -3.60% | 22% |
| 14 | Cambodia | 12,223,590 | 90,557,514 | 0.50% | 14.20% |
| 15 | Mexico | 52,447,512 | 87,497,830 | -4.70% | 2.70% |
| 16 | United Kingdom | 15,610,959 | 87,477,358 | 4.40% | 11.60% |
| 17 | Malaysia | 12,683,967 | 83,559,013 | -14.90% | -5.70% |
| 18 | Italy | 11,610,654 | 80,328,415 | 3.90% | -12.40% |
| 19 | Russia | 20,569,459 | 77,586,468 | -29.60% | -33.60% |
| 20 | Saudi Arabia | 23,471,290 | 74,868,053 | -6.20% | -4.60% |
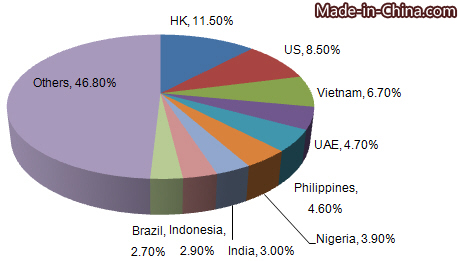
Destinations for China's special woven or tufted fabric export included India, United Arab Emirates, Vietnam, Malaysia, etc in 2015. Hong Kong and United States were major markets for China's special woven or tufted fabric export. China's special woven or tufted fabric exports to Hong Kong declined in 2015 on year and it accounted for 11.5% of China's total special woven or tufted fabric export. From January to December in 2015, China's special woven or tufted fabric exports to Philippines grew 29.8% on year.
China's Special Woven or Tufted Fabric Export Origins in 2015
| No. | Districts | Volume | Value(USD) | on Year | |
| Volume | Value | ||||
| 1 | Zhejiang | 433,692,213 | 2,128,464,977 | -8.20% | -9.10% |
| 2 | Shandong | 220,473,669 | 1,189,017,330 | -7% | -1.30% |
| 3 | Jiangsu | 154,532,300 | 501,245,490 | -10.70% | -12.10% |
| 4 | Fujian | 52,294,866 | 424,254,678 | 21.60% | 13.30% |
| 5 | Shanghai | 25,961,702 | 181,337,099 | -6.20% | -2.70% |
| 6 | Shandong | 16,872,217 | 99,514,610 | -5% | -1.50% |
| 7 | Jiangxi | 7,182,976 | 83,901,467 | -16.80% | -5.70% |
| 8 | Liaoning | 6,852,502 | 56,628,792 | -24.70% | -23.80% |
| 9 | Hebei | 17,516,585 | 41,840,322 | -29.90% | -14.50% |
| 10 | Anhui | 2,497,938 | 14,428,167 | -52.70% | -35.50% |
| 11 | Henan | 7,781,441 | 13,582,202 | -13.10% | -9.10% |
| 12 | Jilin | 4,000,452 | 13,496,909 | 58.10% | 21% |
| 13 | Hunan | 1,712,566 | 12,951,662 | -48.70% | -44.60% |
| 14 | Tianjin | 1,056,174 | 7,255,733 | 27.90% | 31.70% |
| 15 | Chongqing | 580,383 | 6,157,162 | 99% | 55.10% |
| 16 | Xinjiang | 1,695,138 | 4,960,605 | -56.30% | -52.20% |
| 17 | Hubei | 985,874 | 4,885,780 | -17.20% | -13.90% |
| 18 | Beijing | 523,972 | 3,867,321 | -25.50% | -39.10% |
| 19 | Shaanxi | 3,425,700 | 3,392,468 | 49% | -4.60% |
| 20 | Sichuan | 452,297 | 3,234,593 | -48.30% | -56% |
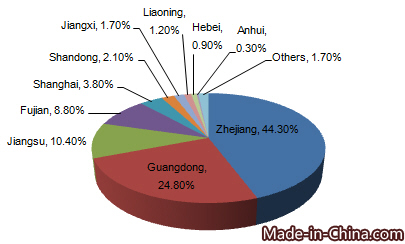
Zhejiang and Guangdong were China's major special woven or tufted fabric export origins. In 2015, their special woven or tufted fabric export value accounted for 68% of China's total. In China's top 20 export origins, Chongqing's special woven or tufted fabric export value grew 55.1% on year.


