China Piano Export Volume & Value in H1 of 2015
| Month | Volume(Units) | Volume(USD) | Year-on-Year | |
| Volume | Value | |||
| Jan. | 3,636 | 6,394,775 | -35.50% | -10.10% |
| Feb. | 3,385 | 5,095,104 | 50.60% | 11.40% |
| Mar. | 2,392 | 4,733,868 | -12.90% | -0.70% |
| Apr. | 2,509 | 4,941,803 | -36.40% | -11.80% |
| May. | 2,860 | 5,398,296 | -44.30% | -8.80% |
| Jun. | 2,565 | 5,432,820 | -44.9 | -11.6 |
| Total | 17,347 | 31,996,666 | -28.80% | -6.70% |
China exported 17,000 pianos in the first half of 2015, down 28.8% by year and piano’s export value was USD 32 million, down 6.7%.
Major Regions for China’s Piano Export
| No. | Region | Volume(Units) | Value(USD) | Year-on-Year | |
| Volume | Value | ||||
| 1 | America | 3,770 | 9,833,960 | -14.50% | 4.40% |
| 2 | HK | 1,188 | 2,997,019 | -73.10% | -12.90% |
| 3 | Germany | 2,050 | 1,962,925 | -5.70% | -27.40% |
| 4 | Korea | 974 | 1,633,551 | 1.20% | 4.50% |
| 5 | Australia | 480 | 1,394,900 | -33.60% | 27.40% |
| 6 | Singapore | 560 | 1,231,184 | -5.60% | 28.70% |
| 7 | Netherland | 556 | 1,139,511 | 3% | 12.80% |
| 8 | England | 929 | 1,123,287 | 6.80% | 16.40% |
| 9 | Iran | 572 | 1,054,294 | -10.80% | -4.40% |
| 10 | Kenya | 169 | 572,771 | 252.10% | 1029.90% |
| 11 | Turkey | 455 | 572,357 | 37% | 22.90% |
| 12 | Thailand | 334 | 571,408 | -54.80% | 104.20% |
| 13 | Russia | 258 | 514,353 | -33.80% | -17% |
| 14 | Japan | 272 | 508,480 | -19.30% | -25.20% |
| 15 | Malaysia | 284 | 504,403 | 21.90% | 20.10% |
| 16 | Poland | 252 | 504,202 | 436.20% | 461.10% |
| 17 | Italy | 334 | 459,073 | -31.70% | -33.80% |
| 18 | Brazil | 645 | 457,166 | 120.90% | 11.90% |
| 19 | France | 343 | 450,493 | 6.50% | -11.80% |
| 20 | Canada | 229 | 436,384 | -38.80% | -47.30% |
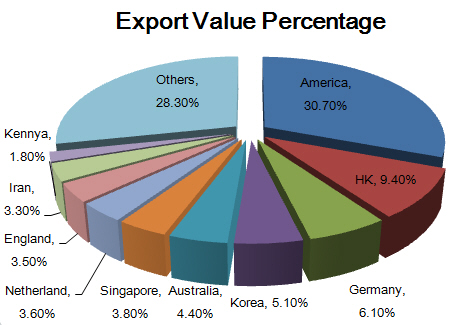
According to the data, America, Hong Kong, Germany and Korea are major regions for China’s piano export and the top 3 market are America, Hong Kong and Germany. The overall proportion of the export value to them was 30.7%, 9.4% and 6.1% respectively. In the first half of 2015, China’s export to America grew the fastest, up 1029.9% by year.
China Piano Export Origins
| No. | District | Volume | Value(USD) | Year-on-Year | |
| Volume | Value | ||||
| 1 | Guangdong | 7,230 | 13,294,762 | -42.40% | -9.60% |
| 2 | Shanghai | 1,545 | 4,933,738 | 10.30% | 21.70% |
| 3 | Zhejiang | 2,355 | 4,812,772 | -37.90% | -7.80% |
| 4 | Tianjin | 2,270 | 2,984,706 | 0.10% | -16% |
| 5 | Shandong | 788 | 2,025,147 | -22.10% | -10.10% |
| 6 | Hubei | 753 | 1,877,680 | 36.70% | 38% |
| 7 | Beijing | 619 | 787,310 | -21.50% | -27% |
| 8 | Liaoning | 605 | 537,181 | 82.20% | 49.20% |
| 9 | Jiangsu | 711 | 458,375 | -37% | -57.40% |
| 10 | Fujian | 439 | 232,953 | -1.30% | -4% |
Guangdong province is China’s largest piano export origin. In the first half of 2015, Guangdong’s export volume made up 41.7% and export value 41.6% of the total. In the top 10 origins, Liaoning’s export value increase 49.2% by year, which is the highest. Hubei’s growth was 38%, ranking second.


