China's Ceramic Sanitary Fixtures Export Volume & Value
| Month | Volume(kg) | Value(USD) | Y-o-Y | |
| Volume | Value | |||
| January | 1,701,724 | 7,443,658 | 2.30% | 47.50% |
| February | 988,033 | 8,401,256 | 66.90% | 412.90% |
| March | 578,169 | 2,593,687 | -42.40% | -21% |
| April | 1,225,301 | 3,212,967 | -6.60% | 9% |
| May | 2,973,680 | 20,254,809 | 107.80% | 571.20% |
| June | 3,948,578 | 31,078,693 | 236.20% | 949.10% |
| July | 3,472,073 | 24,659,937 | 189.60% | 433.40% |
| August | 1,281,953 | 4,621,377 | 16.30% | 12.60% |
| September | 1,368,447 | 5,567,328 | -10.70% | -39.20% |
| October | 1,279,798 | 6,896,905 | 5.10% | -3.50% |
| November | 1,465,742 | 4,595,894 | -13.50% | -61% |
| December | 1,622,902 | 6,007,680 | 1.40% | -47.70% |
| Total | 21,906,400 | 125,334,191 | 41.10% | 86.60% |
From January to December in 2015, China's ceramic sanitary fixtures export volume was 21900 tons, up 41.1% on year and export value was USD 125,000,000, up 86.6% on year.
Major Countries for China's Ceramic Sanitary Fixtures Export
| No. | Country | Volume(kg) | Value(USD) | Y-o-Y | |
| Volume | Value | ||||
| 1 | The United States | 5,217,866 | 27,505,394 | 26.20% | 241.70% |
| 2 | Singapore | 1,241,377 | 11,802,246 | 223% | 123.40% |
| 3 | Australia | 1,303,190 | 5,271,744 | 38% | 92.50% |
| 4 | Korea | 2,151,664 | 5,139,725 | 55.50% | 82% |
| 5 | Thailand | 2,444,649 | 4,875,737 | 54.20% | -16.80% |
| 6 | Panama | 258,900 | 4,151,740 | 3371.90% | 12797.60% |
| 7 | India | 519,961 | 3,917,617 | 72.60% | 206.10% |
| 8 | Mexico | 412,121 | 3,667,671 | 574.40% | 1050.90% |
| 9 | The United Kingdom | 310,789 | 3,255,669 | 660.60% | 887.90% |
| 10 | Germany | 309,764 | 3,248,345 | 111.10% | 341.60% |
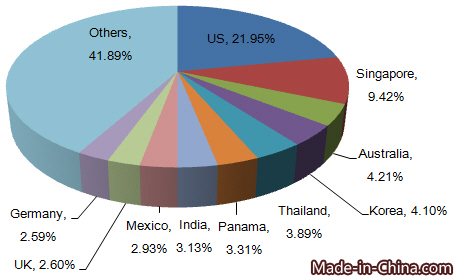
From January to December in 2015, the United States, Singapore and Australia topped the list of export market for China's ceramic sanitary fixtures. Other countries included Korea, Thailand, Panama, India, Mexico, the United Kingdom and Germany.
China's Main Export Origins of Ceramic Sanitary Fixtures
| No. | Province | Volume(kg) | Value(USD) | Y-o-Y | |
| Volume | Value | ||||
| 1 | Guangdong | 11,681,018 | 97,507,704 | 231.40% | 137.30% |
| 2 | Shanghai | 8,591,706 | 16,225,964 | -9.20% | -5.40% |
| 3 | Jiangxi | 273,498 | 2,004,488 | 68.50% | 231.60% |
| 4 | Chongqing | 117,164 | 1,970,625 | 237.30% | 1208% |
| 5 | Zhejiang | 330,245 | 1,751,383 | -75.10% | -57.80% |
| 6 | Inner Mongolia | 135,571 | 1,323,622 | 198% | 118.30% |
| 7 | Sichuan | 58,703 | 651,474 | 116.80% | 47.50% |
| 8 | Anhui | 59,003 | 569,705 | 143.20% | 294.50% |
| 9 | Yunnan | 44,258 | 559,876 | 313.60% | 1698.60% |
| 10 | Fujian | 126,903 | 513,861 | -31.70% | 28.60% |
Guangdong and Shanghai were China's main ceramic sanitary fixtures export origins. From January to December in 2015, their export volume accounted for 92.54% of China's total and export value accounted for 90.74%.


