China's Toy Export Trend in 2011-2014
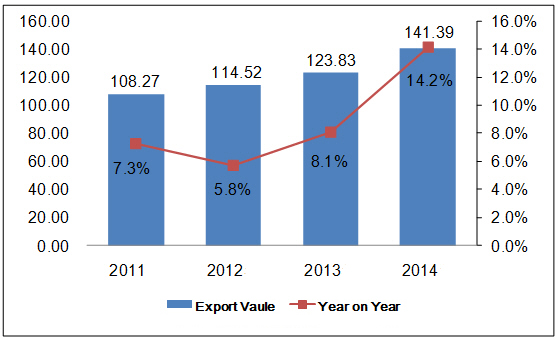
According to the export data, China’s toy kept growing year by year from 2011 to 2014. The amount of China’s export in 2014 was USD 14139 million, 30.6% higher than 2011.
China’s Toy Export Volume & Value in 3Q15
| Month | Volume | Value(USD) | Year-on-Year | |
| Volume | Value | |||
| Jan. | 3,392,676,255 | 1,104,920,011 | -32.90% | 9.30% |
| Feb. | 2,820,270,649 | 908,583,822 | 132.90% | 77.90% |
| Mar. | 1,348,894,817 | 600,381,413 | -33.30% | -21.30% |
| Feb. | 2,327,765,445 | 984,536,936 | 6.40% | 1.70% |
| May. | 2,327,053,953 | 1,128,066,706 | 17.50% | 15.90% |
| Jun. | 2,520,671,284 | 1,283,141,086 | 22.20% | 19.60% |
| Jul. | 2,884,072,272 | 1,578,805,388 | 22.50% | 3.60% |
| Aug. | 3,369,199,939 | 1,926,064,988 | 78.40% | 12% |
| Sep | 3,194,634,652 | 1,984,181,648 | 40% | 17% |
| Total | 24,185,239,266 | 11,498,681,998 | 14.90% | 12.30% |
From January to September in 2015, China’s toy export value was USD 11499 million, increasing 12.3% by year.
Major Countries for China’s Toy Export
| No. | Region | Volume | Value | Year-on-Year | |
| Volume | Value | ||||
| 1 | America | 4,341,387,613 | 3,717,892,683 | 7.60% | 12.40% |
| 2 | England | 654,987,958 | 690,655,391 | 19.20% | 7.10% |
| 3 | Philippines | 1,260,913,715 | 645,987,406 | 34.30% | 41.80% |
| 4 | Hong Kong | 700,700,209 | 591,824,681 | -28.60% | -11.20% |
| 5 | Singapore | 869,115,821 | 520,541,660 | 35.30% | 46.70% |
| 6 | Germany | 387,644,717 | 418,770,423 | -3.80% | 4.30% |
| 7 | Japan | 447,856,042 | 407,314,751 | -4.10% | -0.10% |
| 8 | Korea | 431,068,739 | 360,609,436 | 60.70% | 62% |
| 9 | Netherland | 459,814,002 | 285,226,368 | -7.80% | 11.60% |
| 10 | Mexico | 918,654,937 | 279,826,214 | 65.50% | 18.20% |
| 11 | UAE | 369,452,604 | 245,811,772 | 26.70% | 62.20% |
| 12 | Canada | 271,739,301 | 230,222,162 | 4.80% | 1.10% |
| 13 | Australia | 334,741,688 | 228,878,386 | 7% | 10.70% |
| 14 | France | 234,166,082 | 227,217,202 | 28.70% | 5.70% |
| 15 | Belgium | 252,614,284 | 178,743,089 | 3.50% | 1.60% |
| 16 | Spain | 312,385,817 | 175,234,121 | 25.30% | 2.60% |
| 17 | Russia | 336,073,219 | 169,205,918 | -22.90% | -34.20% |
| 18 | Italy | 286,435,461 | 167,319,466 | -10.30% | 3.60% |
| 19 | Malaysia | 456,089,953 | 150,345,028 | 151.20% | 69% |
| 20 | Brazil | 179,268,513 | 142,338,428 | 13.90% | -0.50% |
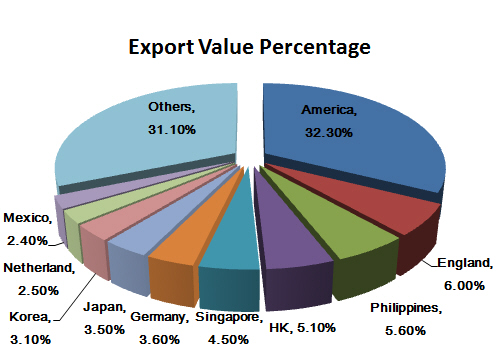
According to the export data, America, England, Philippines, Hong Kong and Singapore were major market for China’s toy from January to September in 2015. America, England and Philippines were the top 3 export markets for China’s toy. During this time, the export to UAE grew fastest, 62.2% higher by year.
China’s Toy Export Enterprises Origins
| No. | District | Volume | Value(USD) | Year-on-Year | |
| Volume | Value | ||||
| 1 | Guangdong | 9,082,201,121 | 7,886,321,274 | 10.6 | 14% |
| 2 | Zhejiang | 3,739,824,588 | 1,600,818,375 | 32 | 20.40% |
| 3 | Jiangsu | 2,834,837,416 | 833,224,492 | 25.3 | -0.80% |
| 4 | Shanghai | 206,320,621 | 268,630,291 | -2.3 | 2.90% |
| 5 | Shandong | 147,727,572 | 243,150,039 | -2.4 | 2.80% |
| 6 | Jiangxi | 208,365,525 | 198,466,635 | 1.7 | -0.90% |
| 7 | Anhui | 141,795,270 | 168,282,299 | 39.8 | 7.50% |
| 8 | Fujian | 411,311,403 | 151,661,314 | 3 | -14% |
| 9 | Hebei | 6,855,313,591 | 47,317,525 | 12.3 | 44.80% |
| 10 | Guangxi | 178,603,070 | 25,338,269 | -8.8 | -3% |
| 11 | Chongqing | 43,954,355 | 14,599,062 | 45 | 45.60% |
| 12 | Henan | 12,865,324 | 12,696,363 | 121.2 | 15.60% |
| 13 | Hunan | 61,518,640 | 11,361,668 | 1322.3 | 133.60% |
| 14 | Beijing | 53,039,171 | 10,159,741 | -47.8 | -22.40% |
| 15 | Tianjin | 45,483,521 | 8,943,075 | -26 | 34.40% |
| 16 | Liaoning | 15,816,887 | 6,900,027 | 9.3 | -5.30% |
| 17 | Xinjiang | 1,657,736 | 4,821,381 | 123.7 | 85% |
| 18 | Hubei | 135,109,401 | 3,669,643 | -7.7 | -33.60% |
| 19 | Jilin | 410,766 | 496,163 | -45 | -24.10% |
| 20 | Guizhou | 4,548,916 | 385,035 | 1313 | 104.30% |
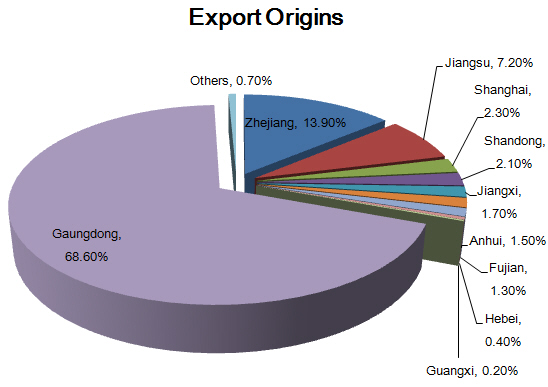
Guangdong, Zhejiang and Jiangsu are major origins where China’s toy export enterprises locate. The three provinces export volume made up 64.7% and export value 89.8% of the total from January to September in 2015. During this time, Hunan’s exports value grew the fastest, up 133.6% by year.


")
