China Iron & Steel Stoves, Ranges, Barbecues Export Volume & Value
| Month | Volume | Value(USD) | Y-O-Y | |
| Volume | Value | |||
| Jan | 128,868,862 | 528,685,932 | -2.70% | 10.60% |
| Feb | 104,305,084 | 416,604,454 | 39.10% | 58.90% |
| Mar | 90,158,542 | 327,979,010 | -11.50% | -4.20% |
| Apr | 100,251,478 | 360,886,095 | -5.30% | 4.50% |
| May | 85,865,314 | 326,251,280 | 13.10% | 25.30% |
| Jun | 69,863,368 | 277,889,344 | 19.80% | 35% |
| Jul | 66,159,060 | 277,022,089 | -8.10% | 2.50% |
| Aug | 56,603,478 | 248,923,471 | -11.70% | 0% |
| Sep | 60,613,896 | 264,862,949 | -6% | 2.80% |
| Total | 762,689,082 | 3,029,104,624 | 1.70% | 13.40% |
From January to September in 2015, China iron & steel stoves, ranges, barbecues export value was USD 3029 million, up 13.4% by year, while the export volume was 1.7% higher than that in the same period of last year.
Major Regions for China's Iron & steel Stoves, Ranges, Barbecues Export
| No. | Country/Region | Volume | Value(USD) | Y-O-Y | |
| Volume | Value | ||||
| 1 | America | 359,130,833 | 1,245,163,451 | 8.90% | 18.20% |
| 2 | Canada | 33,725,309 | 132,752,791 | -6.40% | 9.40% |
| 3 | England | 31,913,550 | 128,598,840 | -7.40% | 14.10% |
| 4 | Australia | 27,620,422 | 122,045,715 | 16.50% | 34.30% |
| 5 | Germany | 28,026,789 | 116,009,580 | -11.80% | 6.40% |
| 6 | Netherland | 23,773,132 | 112,731,700 | 34 | 47.60% |
| 7 | Malaysia | 12,578,112 | 64,916,409 | -4.10% | 1.40% |
| 8 | India | 7,509,072 | 56,597,501 | -25.20% | 41.80% |
| 9 | Thailand | 8,563,676 | 55,055,957 | 18.40% | 126.90% |
| 10 | France | 11,317,474 | 45,665,719 | -18.80% | -1% |
| 11 | Japan | 11,430,926 | 40,913,076 | -16.30% | -9.60% |
| 12 | Singapore | 4,390,609 | 40,252,312 | -12.80% | 8.90% |
| 13 | UAE | 6,712,443 | 39,585,165 | -29.80% | -21.80% |
| 14 | Nigeria | 9,299,019 | 36,592,624 | 12.90% | 35.40% |
| 15 | Italy | 8,815,043 | 33,063,138 | 1.10% | 30.80% |
| 16 | Indonesia | 7,136,004 | 32,046,981 | -16.10% | -24.30% |
| 17 | Philippines | 5,991,392 | 31,570,364 | 37.60% | 127% |
| 18 | South Africa | 7,716,401 | 29,975,670 | 33.40% | 44.30% |
| 19 | Algeria | 9,597,678 | 28,278,807 | -23.70% | -27.30% |
| 20 | Mexico | 8,423,350 | 26,488,810 | 27.60% | 29.80% |
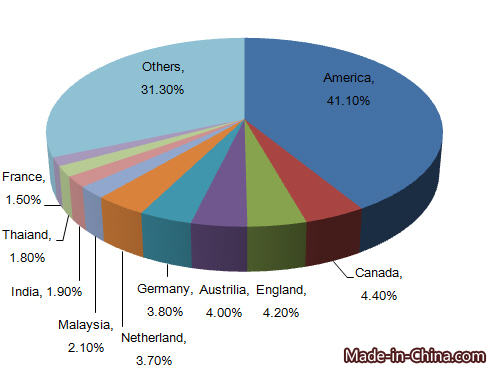
The export data shows that America, Canada, England, Australia, Germany, Netherlands, Malaysia, India, Thailand and France topped the country list for China's iron & steel stoves, ranges, barbecues export. America is the largest export market for China's iron & steel stoves, ranges, barbecues export, followed by Canada and England. The export value China exported to these three countries accounted for 41.1%, 4.4% and 4.2% of China's iron & steel stoves, ranges, barbecues total export value respectively. From January to September in 2015, in the top 20 export markets, the export value China exported to Thailand increased the fastest and the growth was 126.9% higher than that in 2014.
China's Iron & Steel Stoves, Ranges, Barbecues Exports Enterprises Origins
| No. | Region | Volume | Value(USD) | Y-O-Y | |
| Volume | Value | ||||
| 1 | Guangdong | 488,687,476 | 2,065,726,795 | 3.70% | 16.60% |
| 2 | Zhejiang | 106,025,874 | 410,371,079 | -2.50% | 8.80% |
| 3 | Jiangsu | 34,569,241 | 137,707,395 | 0% | 12.70% |
| 4 | Shanghai | 31,902,141 | 94,986,793 | 0.10% | -2.20% |
| 5 | Shandong | 24,515,338 | 57,904,497 | 5.80% | 6.20% |
| 6 | Fujian | 17,523,261 | 57,579,738 | 4.40% | -1.90% |
| 7 | Tianjin | 17,405,210 | 44,567,030 | -17.30% | -24.90% |
| 8 | Hebei | 17,147,567 | 33,130,613 | 6.90% | 5.60% |
| 9 | Hunan | 3,903,950 | 31,656,791 | 7.90% | 118.90% |
| 10 | Liaoning | 6,441,843 | 18,833,704 | 15.30% | 9.90% |
Guangdong is the major origin for China's iron & steel stoves, ranges, barbecues export. From January to September, Guangdong's iron & steel stoves, ranges, barbecues export volume accounted for 64.1% of China's iron & steel stoves, ranges, barbecues total export, while the export value accounted for 68.2% of China's total.
From January to September in 2015, in the top 10 supply source, Hunan's export volume grew the fastest, up 118.9% by year.


