Distribution of China's Miscellaneous Chemical Products Export Enterprises
| No. | District | Export Value | Y-o-Y | ||
| Volume(kg) | Value(USD) | Volume | Value | ||
| 1 | Jiangsu | 1,176,428,564 | 3,285,632,397 | -7.20% | -9.50% |
| 2 | Shandong | 1,195,206,127 | 1,721,763,404 | 5% | -0.20% |
| 3 | Zhejiang | 648,560,978 | 1,553,525,685 | 5.70% | -5% |
| 4 | Guangdong | 587,490,516 | 1,211,221,352 | 10.20% | -1.40% |
| 5 | Shanghai | 259,493,850 | 828,092,383 | -6.10% | -13.10% |
| 6 | Jiangxi | 99,274,474 | 451,125,129 | 8.60% | 6.60% |
| 7 | Tianjin | 251,063,716 | 412,721,223 | -5.30% | -21.10% |
| 8 | Liaoning | 880,806,296 | 403,775,168 | -32.40% | -19.50% |
| 9 | Hebei | 806,350,204 | 356,792,320 | 53.90% | 4.20% |
| 10 | Inner Mongolia | 141,588,241 | 339,100,274 | 78.20% | 41.40% |
From January to December, Jiangsu, Shandong and Zhejiang were the main regions where China's miscellaneous chemical products export enterprise located. The three provinces' total export value accounted for 24.9% of China's total.
Major Countries/Regions for China's Miscellaneous Chemical Products Export
| No. | Country/Region | Export Value | Y-o-Y | ||
| Volume(kg) | Value(USD) | Volume | Value | ||
| 1 | Taiwan | 430,989,733 | 1,834,114,227 | -8.40% | -0.10% |
| 2 | America | 502,163,034 | 1,093,742,700 | 23.60% | 4.80% |
| 3 | Korea | 790,995,311 | 998,726,310 | -8.30% | -8.30% |
| 4 | Japan | 785,757,822 | 859,126,250 | -41.80% | -15.60% |
| 5 | Thailand | 414,643,194 | 582,289,700 | 8.50% | -5.70% |
| 6 | Malaysia | 365,697,685 | 514,740,700 | 32.90% | -5.90% |
| 7 | Indonesia | 467,861,701 | 491,807,711 | 10.50% | -6.30% |
| 8 | Vietnam | 322,346,905 | 475,838,164 | 15.70% | 11% |
| 9 | Hong Kong | 269,720,131 | 422,957,331 | 24.40% | -7.30% |
| 10 | India | 286,536,922 | 380,448,847 | 2.70% | -5.30% |
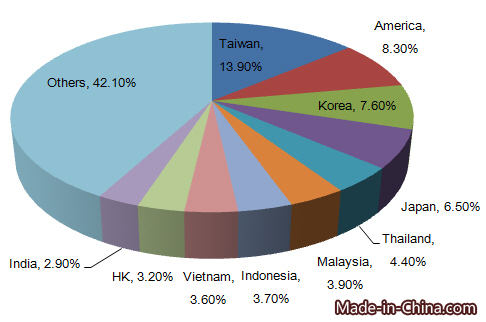
From Jan. to Dec. in 2015, Taiwan, America, Korea, Japan, Thailand, Malaysia, Indonesia, Vietnam, Hong Kong and India were major countries for China's miscellaneous chemical products export, among of which, Taiwan topped the list of the export value. The export value to Taiwan accounted for 13.9% of China's miscellaneous chemical products total export value from January to December in 2015.
Major Countries/Regions in need of Miscellaneous Chemical Products
| Importing Country/Region | Import Value(USD) | Y-o-Y |
| China | 10,975,979,000 | -14.60% |
| Germany | 10,365,203,000 | -14.60% |
| America | 10,089,841,000 | 6.60% |
| France | 5,924,386,000 | -13.60% |
| Korea | 4,867,753,000 | -7.30% |
From January to September in 2015, major miscellaneous chemical products importing countries were China, Germany, America, France and Korea. As the largest importing country, China's import value was USD 10976 million.
Major Miscellaneous Chemical Products Exporting Countries
| Exporting Country/Region | Export Value(USD) | Y-o-Y |
| America | 19,914,610,000 | -4.30% |
| Germany | 17,065,407,000 | -13.80% |
| China | 10,114,559,000 | -6.40% |
| France | 8,832,403,000 | -11.70% |
| Japan | 6,894,763,000 | -8.90% |
From January to September in 2015, major miscellaneous chemical products exporting countries included America, Germany, China, France and Japan. America was the largest export country with the export value of USD 19915 million. China ranked third with the export value of USD 10115 million in the same period.


