Distribution of China's Devices for Printing or Embossing Labels Hand-Operated Export Enterprises
| No. | Region | Export Value | Y-o-Y | ||
| Volume(kg) | Value(USD) | Volume | Value | ||
| 1 | Zhejiang | 2,222,606 | 15,001,568 | -11.10% | -4.10% |
| 2 | Guangdong | 1,537,894 | 13,077,798 | -16.40% | -14.90% |
| 3 | Fujian | 461,996 | 6,086,311 | 12.60% | 22.50% |
| 4 | Shanghai | 444,847 | 5,748,928 | -13.80% | -6.30% |
| 5 | Jiangsu | 321,690 | 5,145,056 | -4.70% | -8.10% |
| 6 | Jiangxi | 12,620 | 262,555 | 15.10% | 170.40% |
| 7 | Tianjin | 3,154 | 128,939 | 307% | 59.60% |
| 8 | Yunnan | 3,572 | 83,772 | 108.50% | 369.90% |
| 9 | Hubei | 2,708 | 76,206 | -29.20% | 632% |
| 10 | Ningxia | 2,075 | 61,488 | / | / |
From January to December in 2015, Zhejiang, Guangdong and Fujian were the main regions where China's devices for printing or embossing labels hand-operated export enterprise located. The three provinces' total export value accounted for 74.4% of China's devices for printing or embossing labels hand-operated total export value.
Major Countries/Regions for China's Devices for Printing or Embossing Labels Hand-Operated Export
| No. | Country/Region | Export Value | Y-o-Y | ||
| Volume(kg) | Value(USD) | Volume | Value | ||
| 1 | America | 1,077,929 | 9,013,436 | 0.10% | 3.80% |
| 2 | Japan | 402,603 | 5,160,908 | 4.30% | -8.10% |
| 3 | England | 241,300 | 3,154,422 | -3.20% | 27.30% |
| 4 | Austria | 206,304 | 3,151,918 | 15.70% | 30.60% |
| 5 | Hong Kong | 387,256 | 2,660,227 | -44.80% | -48.60% |
| 6 | Russia Federation | 140,047 | 1,507,990 | 19.90% | 30.50% |
| 7 | Korea | 104,465 | 1,113,473 | 26.20% | 54.70% |
| 8 | Netherlands | 140,712 | 1,113,471 | -6.40% | -6.70% |
| 9 | India | 141,119 | 1,074,523 | -0.70% | 8.40% |
| 10 | Malaysia | 99,876 | 1,068,179 | -40.80% | 30.60% |
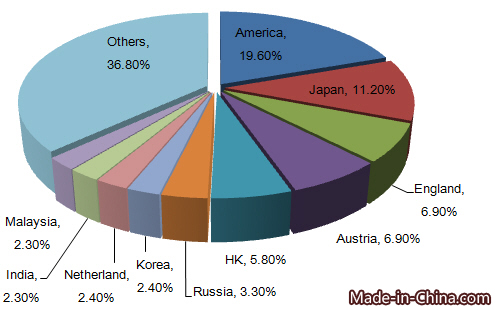
From Jan. to Dec. in 2015, America, Japan, England, Austria, Hong Kong, Russia Federation, Korea, India and Malaysia were major countries for China's devices for printing or embossing labels hand-operated export, among of which, America topped the list of the export value. The export value to America accounted for 19.6% of China's devices for printing or embossing labels hand-operated total export value from January to December in 2015.
Major Countries/Regions in need of Devices for Printing or Embossing Labels Hand-Operated from Jan. to Sep. in 2015
| Importing Country/Region | Import Value(USD) | Y-o-Y |
| America | 44,069,000 | 10.10% |
| Germany | 21,772,000 | -4.90% |
| France | 9,666,000 | -5.20% |
| England | 8,779,000 | -10.80% |
| Japan | 8,607,000 | -14.50% |
From January to September in 2015, major devices for printing or embossing labels hand-operated importing countries were America, Germany, France, England and Japan. As the largest importing country, America's import value was USD 44 million.
Major Devices for Printing or Embossing Labels Hand-Operated Exporting Countries from Jan. to Sep. in 2015
| Exporting Country/Region | Export Value(USD) | Y-o-Y |
| China | 34,625,000 | -2.30% |
| Taiwan | 18,317,000 | -5.30% |
| America | 14,217,000 | 11.60% |
| Germany | 11,831,000 | -14.00% |
| Italy | 7,842,000 | -9.50% |
From January to September in 2015, major devices for printing or embossing labels hand-operated exporting countries included China, Taiwan, America, Germany and Italy. As the largest export country, China's export value was USD 35 million.
")


")

