Distribution of China's Inorganic Chemicals Export Enterprises
| No. | Region | Export Value | Y-o-Y | ||
| Volume(Unit) | Value(USD) | Volume | Value | ||
| 1 | Shandong | 3,875,275,161 | 1,585,040,070 | 2.70% | -5.10% |
| 2 | Jiangsu | 4,398,134,699 | 1,514,970,888 | 16.30% | -3.80% |
| 3 | Hunan | 1,242,223,980 | 825,258,139 | -7% | -28.50% |
| 4 | Shanghai | 482,551,885 | 766,506,645 | 1.70% | 16.90% |
| 5 | Fujian | 485,853,101 | 751,550,851 | -4.70% | -15.30% |
| 6 | Jiangxi | 568,895,074 | 742,375,125 | -4.90% | -19.20% |
| 7 | Henan | 1,038,017,403 | 708,714,839 | -20.90% | -18.50% |
| 8 | Guangdong | 472,110,210 | 673,658,714 | 2.90% | 1.40% |
| 9 | Yunnan | 481,249,295 | 614,690,141 | -9.20% | -14.70% |
| 10 | Zhejiang | 539,146,106 | 608,070,558 | -5.30% | -7.10% |
From January to December, Shandong, Jiangsu and Hunan were the main regions where China's inorganic chemicals export enterprises located. The three provinces' total export value accounted for 29.2% of China's total.
Major Countries/Regions for China's Inorganic Chemicals Export
| No. | Country/Region | Export Value | Y-o-Y | ||
| Volume(Unit) | Value(USD) | Volume | Value | ||
| 1 | Korea | 1,950,854,928 | 1,892,758,091 | -2.10% | -2.60% |
| 2 | Japan | 1,443,358,314 | 1,860,626,113 | 5.70% | -4.80% |
| 3 | America | 1,057,176,556 | 1,091,803,523 | -14% | -25.70% |
| 4 | Thailand | 1,168,712,104 | 643,492,260 | 3.70% | -6.40% |
| 5 | India | 896,897,323 | 585,220,222 | 17.20% | -10% |
| 6 | Taiwan | 655,184,957 | 569,939,155 | -7.10% | -12.60% |
| 7 | Malaysia | 1,263,722,849 | 483,170,858 | 40.40% | 2.90% |
| 8 | Indonesia | 1,192,261,171 | 456,410,514 | -1.30% | -8% |
| 9 | Vietnam | 1,253,922,592 | 383,643,318 | 13.50% | 2.70% |
| 10 | Australia | 901,344,788 | 366,679,384 | -13.10% | -15.60% |
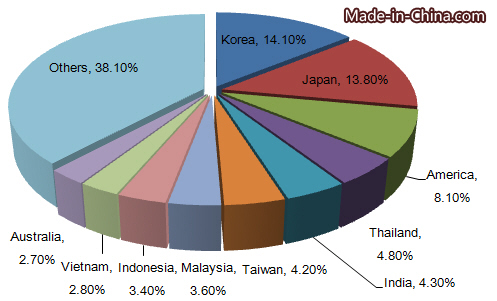
From Jan. to Dec. in 2015, Korea, Japan, America, Thailand, India, Taiwan, Malaysia, Indonesia, Vietnam and Australia were major countries for China's inorganic chemicals export. Korea and Japan topped the list of the export value. The export value to Korea and Japan accounted for 14.1% and 13.8% of China's inorganic chemicals total export value from January to December in 2015.
Major Countries/Regions in need of Inorganic Chemicals from Jan. to Sep. in 2015
| Importing Country/Region | Import Value(USD) | Y-o-Y |
| America | 10,198,111,000 | -3.10% |
| China | 7,376,000,000 | -1.10% |
| Germany | 5,430,420,000 | -14.90% |
| Japan | 4,487,973,000 | -10.70% |
| Korea | 4,110,886,000 | -1.90% |
From January to September in 2015, major inorganic chemicals importing countries were America, China, Germany, Japan and Korea. As the largest importing country, America's import value was USD 10198 million. China ranked second with the export value of USD 7376 million.
Major Inorganic Chemicals Exporting Countries from Jan. to Sep. in 2015
| Exporting Country/Region | Export Value(USD) | Y-o-Y |
| China | 10,235,069,000 | -9.80% |
| America | 9,573,984,000 | 3.60% |
| Germany | 7,084,669,000 | -17.40% |
| Australia | 4,260,828,000 | 0.10% |
| Netherlands | 3,646,581,000 | 3.90% |
From January to September in 2015, major inorganic chemicals exporting countries included China, America, Germany, Australia and Netherlands. China was the largest export country with the export value of USD 10235 million.


