The Importation of Chandeliers & Other Electric Ceiling or Wall Lighting Fittings during Jan. – May 2013
The Import Value Trend of Chandeliers & Other Electric Ceiling or Wall Lighting Fittings during Jan. – May 2013
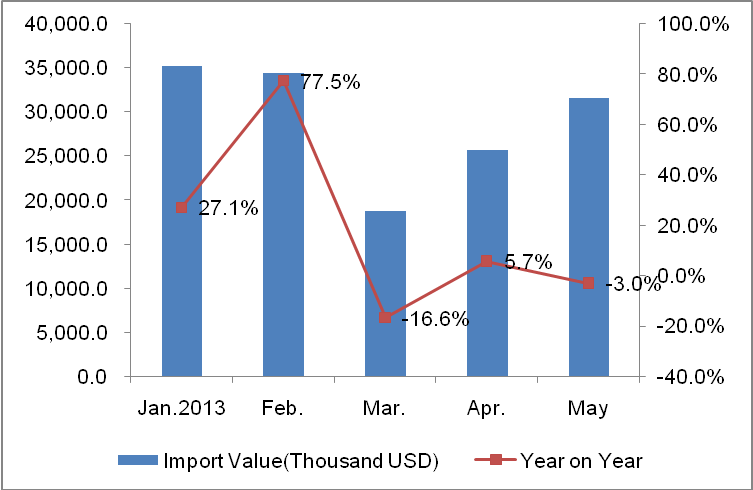
| Month | Value(thousand dollar) | Compared with the same period of last year |
| Jan. | 35,203 | 27.1% |
| Feb. | 34,469 | 77.5% |
| Mar. | 18,752 | -16.6% |
| Apr. | 25,694 | 5.7% |
| May. | 31,641 | -3.0% |
| Total | 145,759 | 15.2% |
During Jan - May.2013, the import value of Chandeliers & Other Electric Ceiling or Wall Lighting Fittings reached 150 million USD During Jan - May.2013, which increased 15.2% as before.
The Mainly Original Goods Delivered Countries for Australian Chandeliers & Other Electric Ceiling or Wall Lighting Fittings during Jan. – May 2013
| Country/Region | Value(thousand dollar) | Compared with the same period of last year |
| China | 100,997 | 33.7% |
| Germany | 6,130 | 10.0% |
| Italy | 4,338 | -7.3% |
| Malaysia | 3,631 | -9.2% |
| Taiwan | 3,153 | 114.5% |
| USA | 2,901 | 34.3% |
| HK | 2,292 | -3.7% |
| UK | 2,242 | 29.2% |
| Indonesia | 2,025 | 85.3% |
| Belgium | 1,773 | 2.8% |
At top ten original places of goods delivered, Taiwan and Indonesia took two biggest increasing, which has 114.5% and 85.3% growth than before. As a important market, the import value of Chandeliers & Other Electric Ceiling or Wall Lighting Fittings from China, reached 100 million USD during Jan - May.2013.
The Importation of Electric Table, Desk, Bedside or Floor-Standing Lamps during Jan. – May 2013
The Import Value of Electric Table, Desk, Bedside or Floor-Standing Lamps during Jan. – May 2013 in Australia
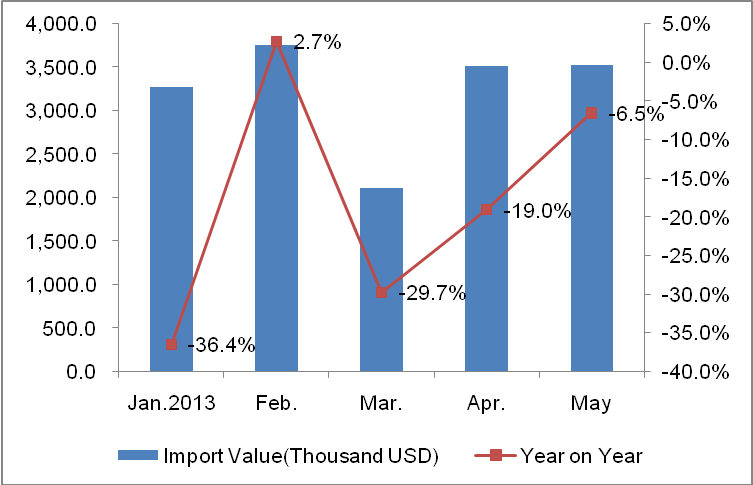
| Month | Value(thousand USD) | Compared with the same period of last year |
| Jan. | 3,278 | -36.4% |
| Feb. | 3,754 | 2.7% |
| Mar. | 2,110 | -29.7% |
| Apr. | 3,516 | -19.0% |
| May. | 3,523 | -6.5% |
| Total | 16,181 | -18.8% |
During Jan - May.2013, the import value of Electric Table, Desk, Bedside or Floor-standing Lamps reached 16.8 million USD During Jan - May.2013, which dropped 18.8% as before.
The Mainly Original Goods Delivered Countries for Australian Electric Table, Desk, Bedside or Floor-Standing Lamps during Jan. – May 2013.
| Country/Region | Value(thousand USD) | Compared with the same period of last year |
| China | 12,350 | -23.2% |
| Italy | 882 | 6.1% |
| India | 524 | -16.0% |
| USA | 357 | 79.4% |
| HK | 299 | 18.2% |
| Philippines | 245 | -26.0% |
| Hungary | 170 | 347.4% |
| UK | 156 | 24.8% |
| Germany | 149 | 88.6% |
| France | 128 | -31.6% |
At top ten original places of goods delivered, Hungary and Germany took two biggest increasing, which has 347.4% and 88.6% growth than before. As a important market, the import value of Electric Table, Desk, Bedside or Floor-standing Lamps from China, reached 12 million USD during Jan - May.2013, which dropped 23.2% than before.
The Importation of Other Electric Lamps and Lighting Fittings(HS:940540) during Jan. – May 2013
The Import Value Trend of Other Electric Lamps and Lighting Fittings during Jan. – May 2013
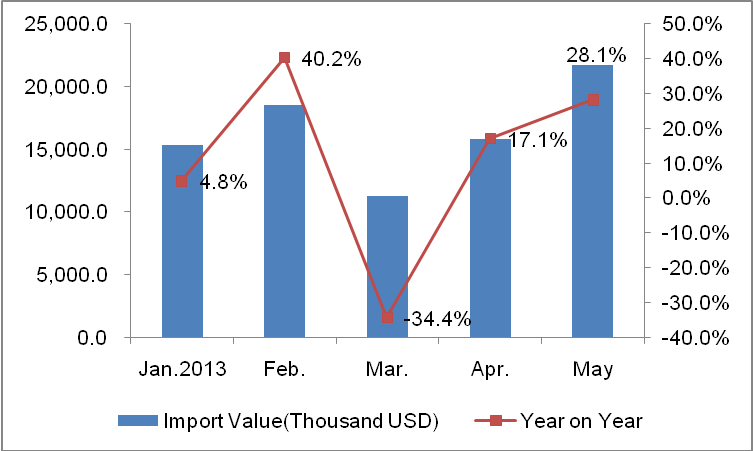
| Month | Value(thousand USD) | Compared with the same period of last year |
| Jan. | 15,357 | 4.8% |
| Feb. | 18,548 | 40.2% |
| Mar. | 11,282 | -34.4% |
| Apr. | 15,811 | 17.1% |
| May. | 21,760 | 28.1% |
| Total | 82,758 | 9.5% |
The import value of Other Electric Lamps and Lighting Fittings reached 83 million USD, which increased 9.5% during Jan - May.2013
The Mainly Original Goods Delivered Countries for Australian Other Electric Lamps and Lighting Fittings during Jan. – May 2013
| Country/Region | Value (thousand USD) | Compared with the same period of last year |
| China | 42,999 | 27.5% |
| USA | 9,407 | -17.3% |
| UK | 5,578 | 19.3% |
| Italy | 4,198 | 4.0% |
| Germany | 4,179 | -4.3% |
| Taiwan | 2,048 | 47.0% |
| HK | 1,798 | 252.5% |
| New Zealand | 1,594 | -25.0% |
| Denmark | 1,488 | 102.2% |
| France | 1,426 | -11.6% |
At top ten original places of goods delivered, HK and Denmark took two biggest increasing, which has 252.5% and 102.2% growth than before. As a important market, the import value of Other Electric Lamps and Lighting Fittings from China, reached 43 million USD during Jan - May.2013, which increased 27.5% than before.
The Importation of Non-Electrical Lamps and Lighting Fittings(HS:940550) during Jan. – May 2013 in Australia
The Import Value of Non-Electrical Lamps and Lighting Fittings during Jan. – May 2013
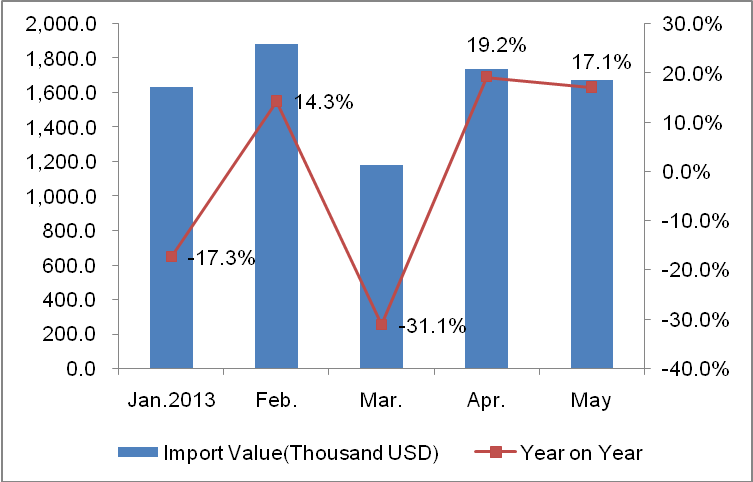
| Month | Value(thousand USD) | Compared with the same period of last year |
| Jan. | 1,633 | -17.3% |
| Feb. | 1,882 | 14.3% |
| Mar. | 1,184 | -31.1% |
| Apr. | 1,739 | 19.2% |
| May. | 1,677 | 17.1% |
| Total | 8,115 | -1.4% |
The import value of Non-electrical Lamps and Lighting Fittings reached 8 million USD, which dropped 1.4% during Jan - May.2013
The Mainly Original Goods Delivered Countries for Australian Non-Electrical Lamps and Lighting Fittings during Jan. – May 2013.
| Country/Region | Value(thousand USD) | Compared with the same period of last year |
| China | 6,424 | 0.2% |
| India | 668 | 11.9% |
| USA | 130 | 17.1% |
| Philippines | 121 | 0.8% |
| Denmark | 98 | -13.3% |
| Vietnam | 86 | -38.6% |
| Poland | 78 | 56.0% |
| HK | 61 | 27.1% |
| Greece | 61 | 7.0% |
| Indonesia | 59 | -37.2% |
At top ten original places of goods delivered, the import value of Non-electrical Lamps and Lighting Fittings from China as the biggest important market, reached 7 million USD during Jan - May.2013.
The Importation of Illuminated Signs, Illuminated Name Plates and the Like (HS:940560)during Jan. – May 2013 in Australia
The Import Value of Illuminated Signs, Illuminated Name Plates and the Like during Jan. – May 2013
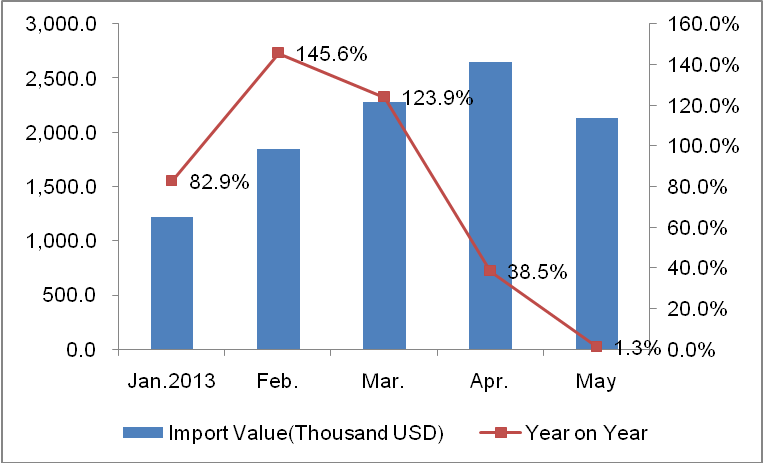
| Month | Value(thousand USD) | Compared with the same period of last year |
| Jan. | 1,222 | 82.9% |
| Feb. | 1,842 | 145.6% |
| Mar. | 2,282 | 123.9% |
| Apr. | 2,649 | 38.5% |
| May. | 2,131 | 1.3% |
| Total | 10,126 | 56.9% |
The import value of Illuminated Signs, Illuminated Name Plates and the Like reached 100 million USD, which increased 1.4% during Jan - May.2013
The Mainly Original Goods Delivered Countries for Australian Illuminated Signs, Illuminated Name Plates and the Like during Jan. – May 2013.
| Country/Region | Value(thousand USD) | Compared with the same period of last year |
| China | 6,831 | 85.1% |
| Malaysia | 1,742 | 273.8% |
| USA | 524 | -8.7% |
| France | 235 | 62.1% |
| Netherlands | 124 | / |
| Germany | 110 | -34.9% |
| Korea | 87 | -38.3% |
| UK | 86 | -16.5% |
| Taiwan | 62 | 287.5% |
| Austria | 55 | 358.3% |
At top ten original places of goods delivered, Austria, Taiwan and Malaysia took three biggest increasing, which has 358.3%, 287.5% and 273.8 growth than before. As a important market, the import value of Illuminated Signs, Illuminated Name Plates and the Like from China, reached 7 million USD during Jan - May.2013, which increased 85.1% than before.


