Abstract:
Since ranked the world's largest stone producing, exporting and consuming countries in 2005, china stone industry has maintained a high growth for eight consecutive years and occupied nearly 20% of global stone processing, production capacity. China stone industry is emerging as the hot spot of the world market, continuing to pull the development of global stone industry.
The latest data shows: from Jan. to Dec. in 2012, the national natural marble building board production reached 128 million square meters, with an increase of 29.11%; the national natural granite output reached 413 million square meters, with an increase of 27.24%. China stone industry secured the harvest in 2012.
| HS Code | Product Name |
| 2515 | Marble, travertine and other calcareous monumental or building stone of an apparent specific gravity ≥ 2.5, alabaster, whether or not roughly trimmed or merely cut or other methods into rectangular (including square) plates, blocks,the following abbreviated "marble, travertine and other calcareous monumental or building stone" |
Export Volume and Value of Chinese Marble, Travertine Calcareous Stone Monument or Building Stones (HS: 2515) from Jan. to Dec. in 2012
| Month | Quantity(Kilogram) | Amount(USD) | Compared with last year | |
|
|
|
| Quantity | Amount |
| January | 9,005,990 | 788,381 | 60.2% | -21.4% |
| February | 3,808,680 | 293,692 | -54.4% | -45% |
| March | 3,381,518 | 521,861 | -16.5% | -34.2% |
| April | 6,378,022 | 694,014 | -25.8% | -13.6% |
| May | 7,334,222 | 783,023 | -21.9% | -20.9% |
| June | 9,430,478 | 1,110,550 | 67.6% | 48.4% |
| July | 5,389,807 | 580,542 | -24.4% | -14.2% |
| August | 3,100,976 | 805,328 | -67.1% | -4.3% |
| September | 16,395,237 | 707,470 | 235.2% | 3.6% |
| October | 2,194,983 | 523,013 | -57.9% | -31.6% |
| November | 10,205,047 | 1,839,239 | 10.4% | 116.8% |
| December | 7,420,816 | 1,003,580 | -18.1% | 6.2% |
| Jan.-Dec. Total | 84,045,776 | 9,650,693 | -3% | 0.2% |
The export volume of Chinese marble, travertine calcareous stone monument or building stones from Jan. to Dec. in 2012 is about 84,000 tons, and export value amounts to 9.65 million dollars. The export volume decreases by 3% year on year and the export value increases by 0.2% year on year.
Main Export Countries/Regions Distribution of Chinese Marble, Travertine Calcareous Stone Monument or Building Stones (HS: 2515) from Jan. to Dec. in 2012
| NO. | Country/Region | Quantity(Kilogram) | Amount(USD) | Compared with last year | |
|
|
|
|
| Quantity | Amount |
| 1 | Taiwan | 61,799,355 | 3,649,223 | 5.2% | -13.6% |
| 2 | Italy | 3,725,377 | 894,780 | 73.7% | 118.1% |
| 3 | India | 3,417,833 | 769,552 | 71.9% | 225.6% |
| 4 | Hong Kong | 4,787,065 | 698,820 | -33% | -31.6% |
| 5 | South Africa | 139,700 | 604,595 | 290942% | 373107% |
| 6 | Thailand | 4,542,064 | 602,071 | -16.5% | -4.6% |
| 7 | Angola | 651,590 | 531,490 | 1647.4% | 11144% |
| 8 | Singapore | 928,251 | 366,897 | -77.6% | -72% |
| 9 | Qatar | 131,350 | 330,667 | 908.8% | 4799.5% |
| 10 | Indonesia | 1,135,499 | 212,589 | -34.5% | 7.7% |
Main Export Countries/Regions Distribution of Chinese Marble, Travertine Calcareous Stone Monument or Building Stones (HS: 2515) from Jan. to Dec. in 2012 (By export value)
Indonesia,Qatar,Singapore,Angola,Thailand,South Africa,Hong Kong,India,Italy,Taiwan,others
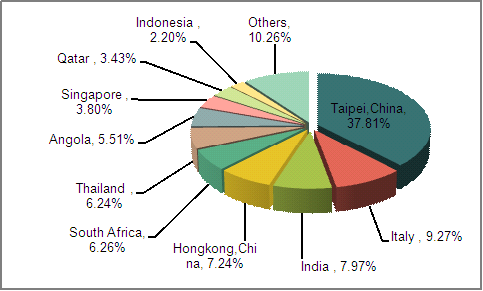
From Jan. to Dec. in 2012, among the top ten export destination countries / regions, as for the export volume, there is a large increase in South Africa (an increase of 290,942%), Angola (an increase of 1647.4%) and Qatar (an increase of 908.8% ); as for export value, there is a large increase in Italy (an increase of 118.1%), India (an increase of 225.6%), South Africa (an increase of 373,107%), Angola (an increase of 11,144%) and Qatar (an increase of 4799.5 %).
Export Average Unit Price Monthly Trend of Chinese Marble, Travertine Calcareous Stone Monument or Building Stones (HS: 2515) from Jan. to Dec. in 2012
Export Average Unit Price Monthly Trend of Chinese Marble, Travertine Calcareous Stone Monument or Building Stones (HS: 2515) from Jan. to Dec. in 2012(USD/ kg)
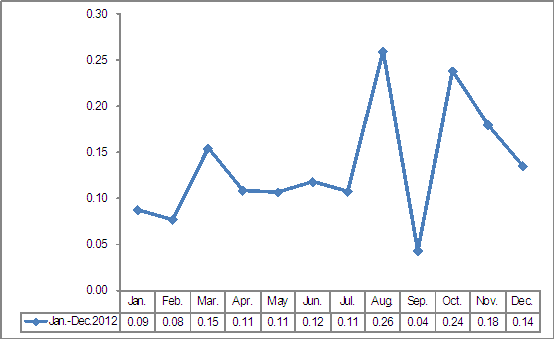
Seen from the export average unit price monthly trend of Chinese marble, travertine calcareous stone monument or building stones from Jan. to Dec. in 2012, the fluctuation of the second half of the year was relatively large.
Export Source Area of Chinese Marble, Travertine Calcareous Stone Monument or Building Stones (HS: 2515) from Jan. to Dec. in 2012
| NO. | Region | Quantity (Kilogram) | Amount(USD) | Compared with last year | |
|
|
|
|
| Quantity | Amount |
| 1 | Guangdong | 10,052,471 | 2,758,553 | -28.6% | 23.5% |
| 2 | Fujian | 16,469,104 | 2,446,210 | -21.4% | -15.9% |
| 3 | Guangxi | 41,875,375 | 946,535 | 30.6% | -4.7% |
| 4 | Shanghai | 2,301,875 | 889,538 | -45.6% | -22.4% |
| 5 | Liaoning | 2,847,652 | 416,648 | 124.8% | 99.6% |
| 6 | Shaanxi | 285,600 | 380,952 | / | / |
| 7 | Hubei | 1,727,929 | 283,109 | 20.9% | 20.9% |
| 8 | Shandong | 731,563 | 229,594 | -36.1% | -4.5% |
| 9 | Yunnan | 1,150,720 | 215,198 | 1.2% | 47.8% |
| 10 | Jiangxi | 758,150 | 196,615 | -56.9% | -30.7% |
Guangdong, Fujian and Guangxi are our main export source areas of marble, travertine and other calcareous monumental or building stone. From Jan. to Dec. in 2012, the export volume of the above three provinces accounted for 81.38% of the total export volume of the product in China; and the export value accounted for 63.74% of the total export value. Among the top ten export source areas of marble, travertine and other calcareous monumental or building stone, both the export volume and value growth of Liaoning province are the biggest, with an increase of 124.8% in export volume and 99.6% in export value.
(Source:China Customs)


