2011-2013 USA Computer Industry Import Performance
2011-2013 USA Computer Industry Import Value Annual Trend
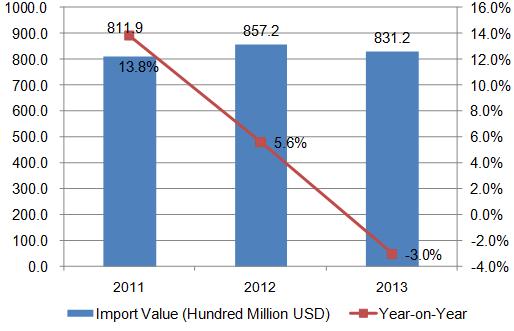
2011-2013 USA’s Computer import values are 811.9 billion US dollars, 857.2 billion US dollars and 831.2 billion US dollars, the imports value goes down with each passing year.
2011-2013 USA Computer Industry Major Import Market Trend Analysis
| No. | Countries/ Regions | Import Value(USD) | Growth in 2013 compared with 2011 | ||
| 2011 | 2012 | 2013 | |||
| Total | 81,194,054 | 85,716,185 | 83,120,872 | 2.4% | |
| 1 | China | 54,201,529 | 55,963,198 | 54,831,870 | 1.2% |
| 2 | Mexico | 13,787,420 | 15,325,021 | 13,664,958 | -0.9% |
| 3 | Thailand | 2,899,243 | 4,289,576 | 4,566,595 | 57.5% |
| 4 | Taiwan | 1,817,531 | 1,592,551 | 1,557,570 | -14.3% |
| 5 | Viet Nam | 30,603 | 144,758 | 1,259,608 | 4016.0% |
| 6 | Malaysia | 1,643,940 | 1,547,458 | 1,224,678 | -25.5% |
| 7 | Singapore | 1,376,452 | 1,385,140 | 1,117,407 | -18.8% |
| 8 | Republic of Korea | 974,361 | 1,228,610 | 933,057 | -4.2% |
| 9 | Japan | 1,023,621 | 961,791 | 880,170 | -14.0% |
| 10 | Philippines | 482,844 | 656,009 | 591,389 | 22.5% |
From 2013, China is the USA's largest importer of computer, the import value of China to USA was 548.32 billion US dollars, which increased 1.2% than 2011, followed by Mexico and Thailand. Compared with 2011, among the USA's first ten original places of imported goods, the imports from Viet Nam increased 40.16% year on year, which grows fastest, the imports from Thailand increased 57.5% year on year, which grows fast too.
2011-2013 USA Computer Industry Major Import Market Share Trend Analysis
| No. | Countries/ Regions | Import Value Share | ||
| 2011 | 2012 | 2013 | ||
| 1 | China | 66.8% | 65.3% | 66.0% |
| 2 | Mexico | 17.0% | 17.9% | 16.4% |
| 3 | Thailand↑ | 3.6% | 5.0% | 5.5% |
| 4 | Taiwan | 2.2% | 1.9% | 1.9% |
| 5 | Viet Nam↑ | 0.0% | 0.2% | 1.5% |
| 6 | Malaysia↓ | 2.0% | 1.8% | 1.5% |
| 7 | Singapore↓ | 1.7% | 1.6% | 1.3% |
| 8 | Republic of Korea | 1.2% | 1.4% | 1.1% |
| 9 | Japan↓ | 1.3% | 1.1% | 1.1% |
| 10 | Philippines | 0.6% | 0.8% | 0.7% |
Note: “↑”represents that the indicators listed, continued to increase from 2011 to 2013, “↓”represents that the indicators listed, continued to decrease from 2011 to 2013.
From 2013, USA imported nearly two-thirds of computers from China. From 2011-2013, among the USA first ten import markets, Thailand and Viet Nam's market share both increased year by year; Malaysia, Singapore, and Japan's market share is declining year by year.
2014 USA Computer Industry Import Performance
2014 USA Computer Industry Major Import Market
| Countries/ Regions | 2014 Import Value(Thousand USD) | Year-on-Year | Share |
| Total | 82,117,757 | -1.2% | 100% |
| China | 54,150,785 | -1.2% | 65.9% |
| Mexico | 13,543,651 | -0.9% | 16.5% |
| Thailand | 4,521,312 | -1.0% | 5.5% |
| Viet Nam | 1,783,794 | 41.6% | 2.2% |
| Taiwan | 1,627,759 | 4.5% | 2.0% |
| Malaysia | 1,060,646 | -13.4% | 1.3% |
| Singapore | 780,272 | -30.2% | 1.0% |
| Philippines | 765,345 | 29.4% | 0.9% |
| Japan | 727,007 | -17.4% | 0.9% |
| Republic of Korea | 640,983 | -31.3% | 0.8% |


