2011 Chinese LED lamps (HS: 94054090) exports
With governments around the world vigorously supporting and promoting its production and sales, the LED lighting industry witnessed a rapid development in 2011. The global annual demand of lighting sets has reached 12 billion, becoming the largest consumption of electric products. The unexpected rise in the price of Phosphor bizarre has led to the increase in the cost of fluorescent lamps; meanwhile, the manufacturing technology of LED lights has made substantial progress, which in turn has reduced the cost rapidly. During the end of 2011 and early 2012, Q2 witnessed an estimated drop of up to 30-50%. Besides, the problem of nuclear power in Japan after the earthquake has created an increased demand for LED lamps in the post-earthquake reconstruction.
Export Quantity & Value for Chinese LED lamps (HS: 94054090)in 2011
| Month | 2011 | Year on Year(±%) | ||
|
| Export Quantity kg | Export Value USD | Quantity | Value |
| Jan. | 56,301,756 | 382,567,744 | 42.2 | 50 |
| Feb. | 26,561,793 | 228,832,551 | -24 | 0.2 |
| Mar. | 38,663,891 | 340,514,534 | 18.5 | 48.7 |
| Apr. | 39,259,004 | 351,918,751 | -1.3 | 35.4 |
| May | 36,269,093 | 338,621,557 | -23.4 | 22 |
| Jun. | 35,169,149 | 347,072,107 | -31 | 29.4 |
| Jul. | 40,727,226 | 398,881,490 | -23.7 | 33.4 |
| Aug. | 46,464,332 | 464,338,635 | -13.6 | 45.4 |
| Sep. | 38,257,688 | 422,740,533 | -22.5 | 28.5 |
| Oct. | 31,302,062 | 358,901,795 | -23.3 | 29.2 |
| Nov. | 33,035,607 | 408,842,274 | -25.1 | 31.9 |
| Dec. | 39,157,663 | 453,194,540 | -26.3 | 27.4 |
| Total | 461,169,264 | 4,496,426,511 | -14.6 | 31.9 |
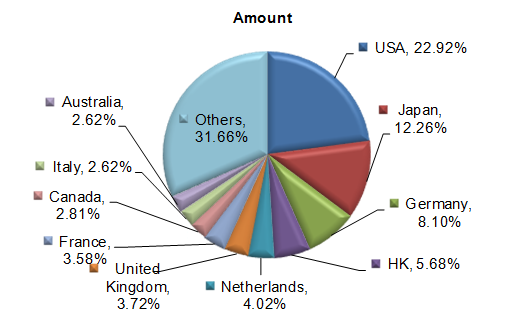
Major importers for Chinese LED lamps (HS: 94054090) in 2011(Sorted by Value)
| No. | Country/Region | 2011 | Year on Year(±%) | ||
| Import Quantity kg | Import Value USD | Quantity | Value | ||
| 1 | USA | 127,809,849 | 1,030,756,993 | -2.7 | 19.7 |
| 2 | Japan | 12,497,244 | 551,249,921 | 76.2 | 195 |
| 3 | Germany | 25,401,181 | 364,422,713 | -3.4 | 42.3 |
| 4 | HK | 14,922,240 | 255,453,099 | -60.2 | 39.2 |
| 5 | Netherlands | 18,124,343 | 180,774,361 | 0.4 | 14.9 |
| 6 | United Kingdom | 20,453,663 | 167,158,718 | -13.1 | 7.4 |
| 7 | France | 17,279,789 | 161,028,951 | -7.7 | 7.3 |
| 8 | Canada | 16,803,954 | 126,420,371 | -3.3 | 12.8 |
| 9 | Italy | 9,586,215 | 117,989,147 | -17.2 | 11.9 |
| 10 | Australia | 11,407,573 | 117,599,840 | -10.6 | 23.8 |
| 11 | Russian Federation | 14,360,140 | 112,432,199 | 9.6 | 74.8 |
| 12 | Belgium | 10,498,242 | 92,993,350 | -23.7 | -9.4 |
| 13 | Spain | 8,501,210 | 89,541,410 | -14.9 | 21 |
| 14 | Turkey | 4,726,554 | 68,151,821 | 12.7 | 59.9 |
| 15 | Poland | 7,375,113 | 60,832,976 | 7.3 | 31.3 |
| 16 | Mexico | 5,512,872 | 51,300,881 | -14.6 | 31.1 |
| 17 | Brazil | 5,428,687 | 50,332,963 | -42.7 | 50.2 |
| 18 | Sweden | 4,790,399 | 47,260,762 | -8.9 | 15 |
| 19 | Taiwan, China | 2,043,500 | 46,917,764 | 16.3 | 58.1 |
| 20 | United Arab Emirates | 7,387,472 | 37,609,919 | -9.4 | 14.9 |
Major Cities/Provinces for Chinese LED lamps (HS: 94054090) export in 2011(Sorted by Value)
| No. | City/Province | 2011 | Year on Year(±%) | ||
|
|
| Export Quantity kg | Export Value USD | Quantity | Value |
| 1 | Guangdong | 174,852,849 | 1,934,425,581 | -30.6 | 25.8 |
| 2 | Zhejiang | 193,305,365 | 1,414,625,945 | -4.9 | 26.6 |
| 3 | Jiangsu | 27,936,488 | 355,786,893 | 12.9 | 58.7 |
| 4 | Shanghai | 25,601,108 | 302,980,103 | 16.7 | 42.4 |
| 5 | Fujian | 23,520,798 | 237,495,569 | 1.3 | 41.7 |
| 6 | Liaoning | 1,541,015 | 104,508,864 | 211 | 185.9 |
| 7 | Shandong | 6,907,855 | 45,058,596 | 15.4 | 10.2 |
| 8 | Tianjin | 622,208 | 18,819,728 | -18.8 | 107.4 |
| 9 | Shanxi | 508,375 | 13,996,197 | 46.1 | 57.1 |
| 10 | Beijing | 976,653 | 12,239,600 | -12.1 | 13.5 |


