China Major Lights & Lighting Products Exports from Jan. to Nov. in 2013 (by export value)
| Product Name | Measurement Units | Volume | Value (USD) | Compared to the same period of last year | |
| Volume | Value | ||||
| 940510 Chandeliers and other electric ceiling or wall lighting fittings, excluding those of a kind used for lighting public open spaces or thoroughfares | Piece | 503,945,763 | 4,280,532,364 | 21.8% | 71.2% |
| 940540 Searehlights | - | 589,489,065 | 7,864,660,143 | 31.9% | 47.6% |
| 940599 Other | Kg | 279,514,933 | 3,147,572,300 | -16.1% | -18.2% |
| 940591 of glass | Kg | 162,953,402 | 1,805,187,343 | -6.3% | 5.7% |
| 940520 Electric table, desk, bedeside or floorstanding lamps | Set | 152,007,489 | 1,587,220,973 | 24.5% | 97.6% |
| 940530 Lighting sets of a kind used for Christmas trees | Set | 575,471,640 | 1,462,780,646 | -40.9% | 16.7% |
| 940550 Nonelectrical lamps and lighting fittings | Kg | 158,406,977 | 834,333,940 | -13.1% | -7.4% |
| 940592 of plastics | Kg | 48,404,927 | 566,923,736 | -19.2% | -24.7% |
| 940560 Illuminated signs, illuminated name plates and the like | Kg | 27,222,433 | 332,981,572 | -7.8% | -0.1% |
China Lights & Lighting Export Volume and Value from Jan. to Nov. in 2013
| Month | Volume (-) | Value (USD) | Compared to the same period of last year | |
| Volume | Value | |||
| Jan. | 188,530,302 | 1,870,420,153 | 10.7% | 85% |
| Feb. | 136,093,900 | 1,420,738,480 | -76.1% | 157.7% |
| Mar. | 123,085,050 | 1,226,392,423 | -17% | 16.1% |
| Apr. | 170,337,771 | 1,744,061,833 | 2.9% | 17.1% |
| May | 199,600,909 | 1,864,040,900 | 4.5% | 2% |
| Jun. | 208,342,136 | 1,792,611,163 | -4.6% | -1.3% |
| Jul. | 273,912,382 | 2,073,458,106 | 2.7% | -1.9% |
| Aug. | 355,730,516 | 2,351,566,772 | -0.5% | 3.8% |
| Sep. | 355,594,773 | 2,403,373,387 | 18.5% | 12% |
| Oct. | 268,177,965 | 2,523,344,085 | 31.4% | 45.1% |
| Nov. | 218,010,925 | 2,612,185,715 | 50.3% | 85.1% |
| Jan.- Nov. Total | 2,497,416,629 | 21,882,193,017 | -8.7% | 25.6% |
The export value of China lights & lighting from Jan. to Nov. in 2013 amounted to 21.882 billion US dollars, with an increase of 25.6% compared to the same period of last year.
China Lights & Lighting Major Export Countries/Regions Distribution from Jan. to Nov. in 2013
| No. | Country | Volume (-) | Value (USD) | Compared to the same period of last year | |
| Volume | Value | ||||
| 1 | USA | 623,429,807 | 5,136,288,029 | 5% | 15.7% |
| 2 | Germany | 144,609,259 | 1,506,948,195 | 10.8% | 21% |
| 3 | UK | 98,656,753 | 1,001,708,072 | 11.9% | 17.7% |
| 4 | Japan | 40,459,608 | 943,712,485 | 3.9% | -6.9% |
| 5 | Netherlands | 84,979,765 | 870,595,560 | 4.6% | 14.9% |
| 6 | Canada | 67,605,124 | 709,460,077 | 3.6% | 20.9% |
| 7 | Malaysia | 55,219,978 | 704,496,626 | 14% | 100.6% |
| 8 | Hong Kong | 67,144,339 | 678,893,542 | -85.9% | 48% |
| 9 | Singapore | 40,489,065 | 595,203,058 | 55.5% | 100.3% |
| 10 | France | 48,986,960 | 523,916,100 | 0.3% | 23% |
| 11 | Australia | 42,500,644 | 492,790,838 | -1.2% | 10.6% |
| 12 | Russian Federation | 68,828,193 | 465,630,317 | 19% | 40.2% |
| 13 | India | 108,903,308 | 427,691,123 | 78.1% | 123.4% |
| 14 | UAE | 46,355,857 | 423,047,632 | 28.2% | 53.9% |
| 15 | Indonesia | 31,647,023 | 394,312,264 | -2.7% | 61.3% |
| 16 | Italy | 38,794,448 | 390,837,604 | 10.6% | 27.1% |
| 17 | Spain | 33,214,294 | 365,611,336 | 3.4% | 28.1% |
| 18 | Brazil | 74,295,471 | 343,980,155 | -18.2% | 30.1% |
| 19 | South Korea | 26,549,926 | 291,874,038 | 17.6% | 78.1% |
| 20 | Poland | 33,148,235 | 285,692,162 | -1.1% | 8.8% |
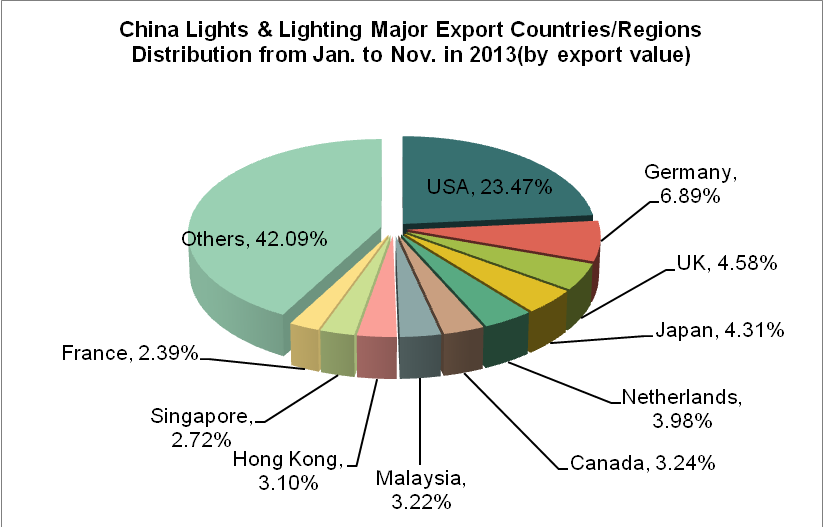
China lights & lighting's main export markets are the United States, Germany, the United Kingdom and Japan and so on from Jan. to Nov. in 2013. Among of which, the export value to the United States accounted for 23.47% of the total export value of the products.
China Lights & Lighting Original Places of Exported Goods from Jan. to Nov. in 2013
| No. | Region | Volume (Kg) | Value (USD) | Compared to the same period of last year | |
| Volume | Value | ||||
| 1 | Guangdong | 1,270,602,302 | 13,030,085,482 | 11.4% | 39.8% |
| 2 | Zhejiang | 793,765,974 | 3,839,621,047 | 16% | 20.1% |
| 3 | Jiangsu | 106,025,746 | 1,093,259,833 | 5.5% | 2.8% |
| 4 | Fujian | 81,659,848 | 1,044,026,634 | -0.2% | 18.1% |
| 5 | Shanghai | 64,336,538 | 793,073,585 | -3.2% | 14.5% |
| 6 | Liaoning | 17,362,657 | 371,195,530 | 49.5% | 2.8% |
| 7 | Jiangxi | 22,758,372 | 269,632,764 | 14% | 27.3% |
| 8 | Anhui | 21,826,026 | 220,783,989 | 9.6% | -17.1% |
| 9 | Chongqing | 10,437,606 | 179,985,057 | -62.5% | -72.8% |
| 10 | Sichuan | 13,596,080 | 157,829,699 | 9.1% | 19.7% |
| 11 | Xinjiang Uygur Autonomous Region | 19,850,119 | 128,590,348 | -6.4% | -6.2% |
| 12 | Shandong | 25,379,361 | 126,071,862 | -5.2% | 11.3% |
| 13 | Yunnan | 9,153,073 | 113,620,356 | 3413.6% | 4757.5% |
| 14 | Guizhou | 3,446,697 | 89,759,352 | 139.4% | 138.6% |
| 15 | Hunan | 5,353,063 | 88,613,470 | 490.6% | 202.4% |
| 16 | Heilongjiang | 4,020,083 | 66,997,677 | 127.5% | 203.5% |
| 17 | Shanxi | 4,459,772 | 62,561,653 | 14.5% | 49.5% |
| 18 | Hubei | 5,175,314 | 42,099,462 | -7.8% | 76.5% |
| 19 | Tianjin | 2,242,602 | 41,143,593 | 7.8% | -28.1% |
| 20 | Beijing | 2,167,174 | 32,405,996 | -14.3% | 18.6% |
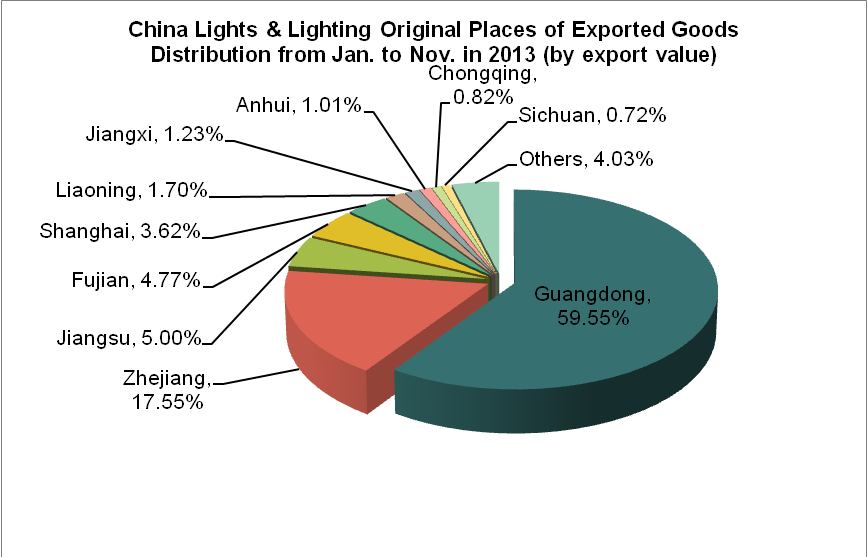
China lights & lighting are mainly exported from Guangdong and Zhejiang from Jan. to Nov. in 2013. Among of which, the export value of Guangdong accounted for 59.55% of China's total export value of the product, while the export value of Zhejiang accounted for 17.55% of China's total export value of the product.
(Source: China Customs)


