| HS Code | Product Name |
| 95030010 | Tricycles, scooters, pedal cars and similar wheeled toys; doll's carriage |
| 95030021 | Pet Toys |
| 95030029 | Doll |
| 95030031 | Electric trains |
| 95030039 | Reduced-size ("scale") outfits model assembly |
| 95030040 | Other construction sets and constructional toys |
| 95030050 | Toy musical instruments and apparatus |
| 95030060 | Puzzles |
| 95030081 | Put up in sets or outfits |
| 95030082 | Other toys and models incorporating a motor |
| 95030089 | Other toys not elsewhere specified or included |
| 95030090 | Parts and accessories |
The United States Import Volume Annual Trend of Tricycles, Scooters, Pedal Cars and Similar Wheeled Toys; Doll's Carriage from China from Jan. to June of 2010-2013
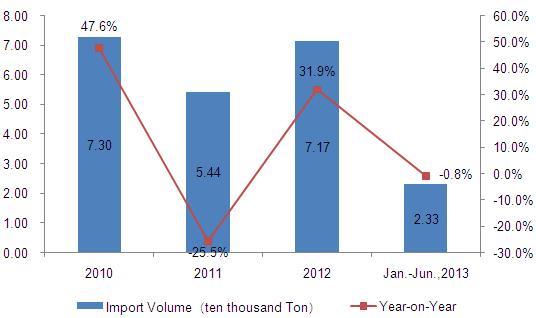
The United States Import Volume of tricycles, scooters, pedal cars and similar wheeled toys, doll's carriage from China showed a trend of "V" from 2010 to 2012. From Jan. to June in 2013, the import volume amounted to 23,300 tons, with a decrease of 0.8%.
The United States Import Value Annual Trend of Tricycles, Scooters, Pedal Cars and Similar Wheeled Toys; Doll's Carriage from China from Jan. to June of 2010-2013
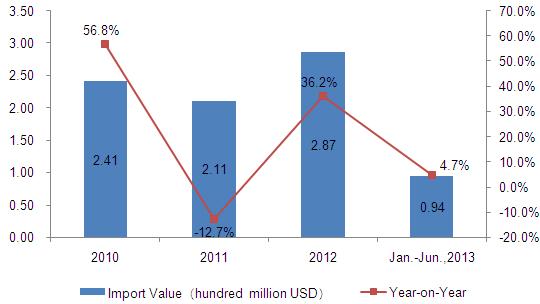
The United States import value of tricycles, scooters, pedal cars and similar wheeled toys, doll's carriage from China showed a trend of "V" from 2010 to 2012. From Jan. to June in 2013, the import value amounted to 94 million US dollars, with an increase of 4.7%.
The United States Import Volume Annual Trend of Pet Toys from China from Jan. to June of 2010-2013
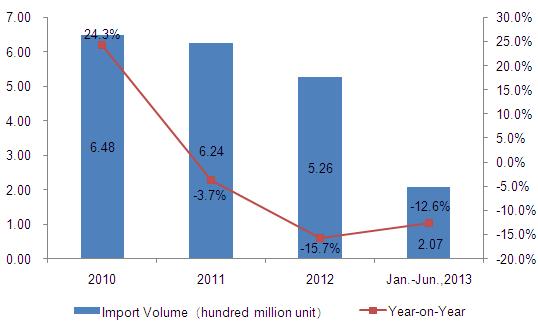
The United States import volume of pet toys from China decreased year by year from 2010 to 2012. From Jan. to June in 2013, the import volume amounted to 207 million, with a decrease of 12.6%.
The United States Import Value Annual Trend of Pet Toys from China from Jan. to June of 2010-2013
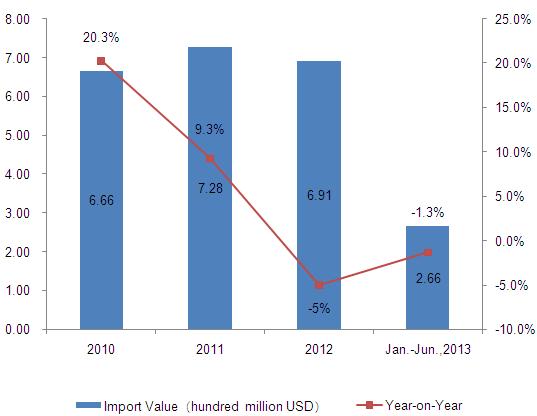
The United States import value of pet toys from China showed a trend of inverted "V" from 2010 to 2012. From Jan. to June in 2013, the import value amounted to 266 million US dollars, with an increase of 1.3%.
The United States Import Volume Annual Trend of Doll from China from Jan. to June of 2010-2013
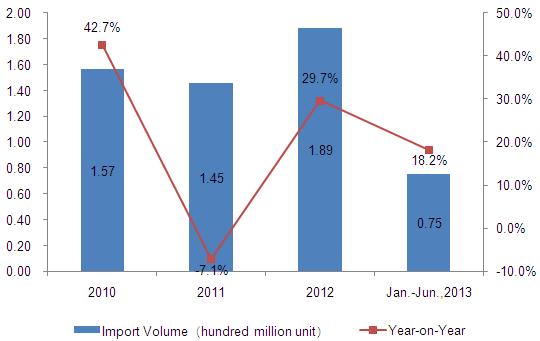
The United States import volume of dolls from China showed a trend of "V" from 2010 to 2012. From Jan. to June in 2013, the import volume amounted to 75 million, with an increase of 18.2%.
The United States Import Value Annual Trend of Doll from China from Jan. to June of 2010-2013
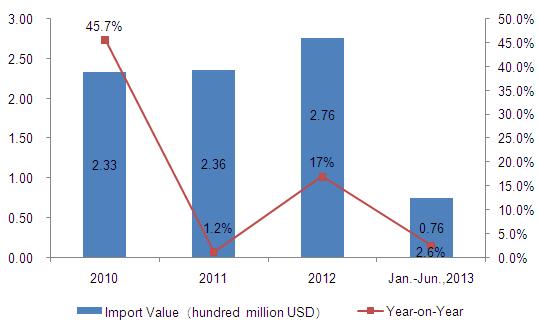
The United States import volume of doll from China increased year by year from 2010 to 2012. From Jan. to June in 2013, the import volume amounted to 76 million, with an increase of 2.6%.
The United States Import Volume Annual Trend of Electric Trains from China from Jan. to June of 2010-2013
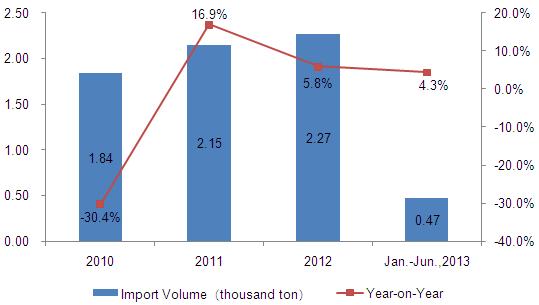
The United States import volume of electric trains from China increased year by year from 2010 to 2012. From Jan. to June in 2013, the import volume amounted to 470 tons, with an increase of 4.3%.
The United States Import Value Annual Trend of Electric Trains from China from Jan. to June of 2010-2013
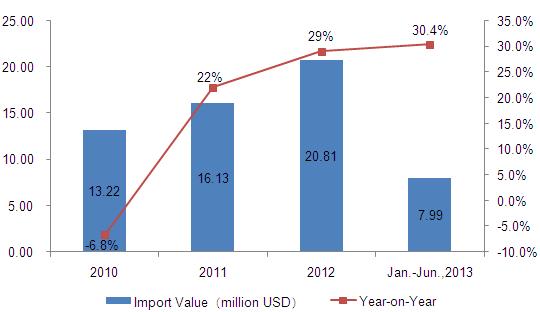
The United States import value of electric trains from China increased year by year from 2010 to 2012. From Jan. to June in 2013, the import value amounted to 7.99 million US dollars, with an increase of 30.4%.
The United States Import Volume Annual Trend of Reduced-Size ("Scale") Outfits Model Assembly from China from Jan. to June of 2010-2013
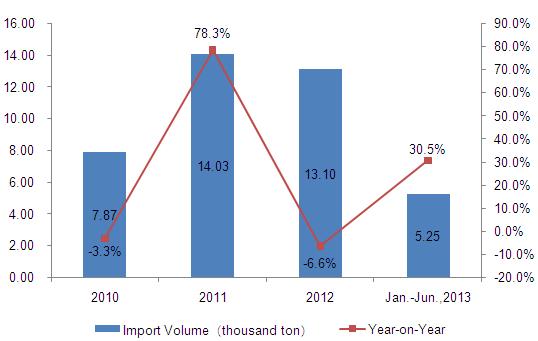
The United States import volume of reduced-size ("Scale") outfits’ model assembly from China showed a trend of inverted "V" from 2010 to 2012. From Jan. to June in 2013, the import volume amounted to 5250 tons, with an increase of 30.5%.
The United States Import Value Annual Trend of Reduced-Size ("Scale") Outfits Model Assembly from China from Jan. to June of 2010-2013
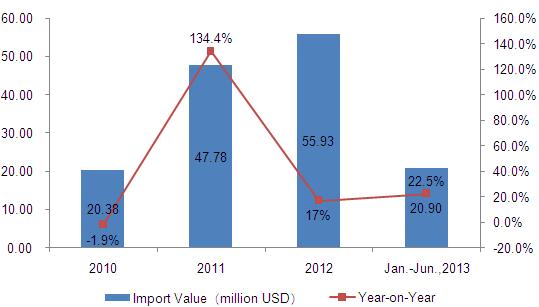
The United States import value of reduced-size ("scale") outfits model assembly from China increased year by year from 2010 to 2012. From Jan. to June in 2013, the import value amounted to 20.9 million US dollars, with an increase of 22.5%.
The United States Import Volume Annual Trend of other Construction Sets and Constructional Toys from China from Jan. to June of 2010-2013
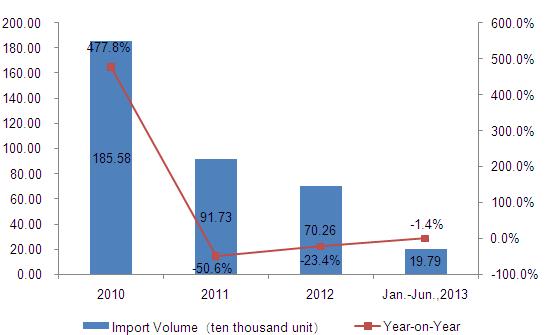
The United States import volume of other construction sets and constructional toys from China decreased year by year from 2010 to 2012. From Jan. to June in 2013, the import volume amounted to 197900, with a decrease of 1.4%.
The United States Import Value Annual Trend of other Construction Sets and Constructional Toys from China from Jan. to June of 2010-2013
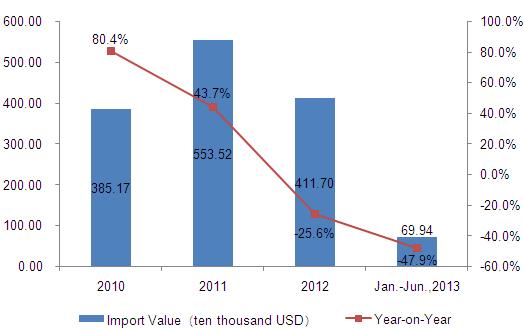
The United States import value of other construction sets and constructional toys from China showed a trend of inverted "V" from 2010 to 2012. From Jan. to June in 2013, the import value amounted to 699,400 US dollars, with a decrease of 47.9%.
The United States Import Volume Annual Trend of Toy Musical Instruments and Apparatus from China from Jan. to June of 2010-2013
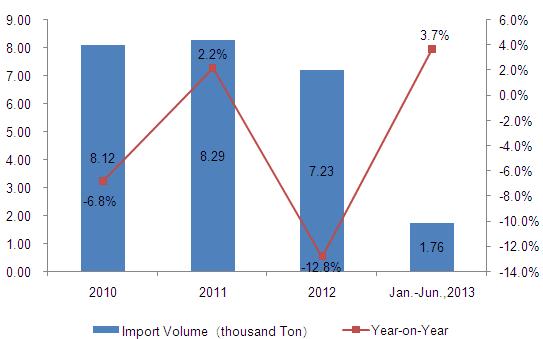
The United States import volume of toy musical instruments and apparatus from China had a little change from 2010 to 2012. From Jan. to June in 2013, the import volume amounted to 1760 tons, with an increase of 3.7%.
The United States Import Value Annual Trend of Toy Musical Instruments and Apparatus from China from Jan. to June of 2010-2013
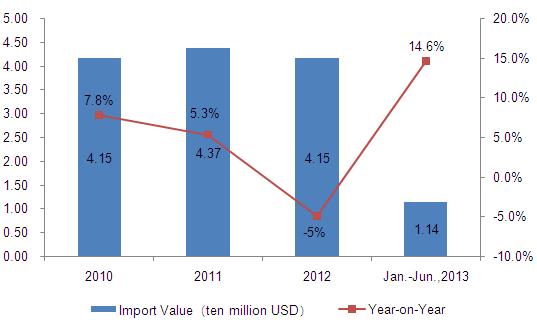
The United States import value of toy musical instruments and apparatus from China had a little change from 2010 to 2012. Import value of 2012 was slightly lower than that of 2011, and is impartial with that of 2010. From Jan. to June in 2013, the import value amounted to 11.4 million US dollars, with an increase of 14.6%.
The United States Import Volume Annual Trend of Puzzles from China from Jan. to June of 2010-2013
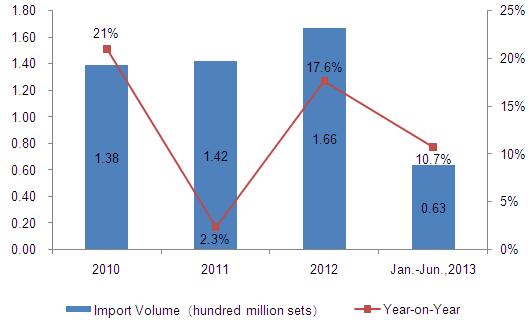
The United States import volume of puzzles from China increased year by year from 2010 to 2012. From Jan. to June in 2013, the import volume amounted to 63 million, with an increase of 10.7%.
The United States Import Value Annual Trend of Puzzles from China from Jan. to June of 2010-2013
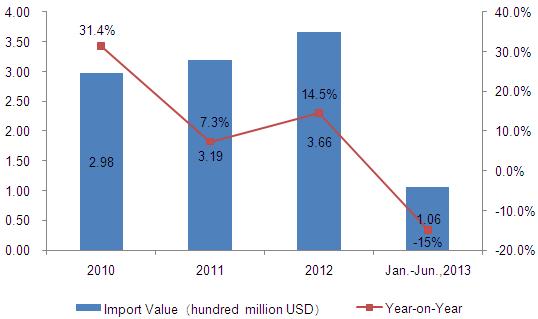
The United States import value of puzzles from China increased year by year from 2010 to 2012. From Jan. to June in 2013, the import value amounted to 106 million US dollars, with an increase of 15%.
The United States Import Volume Annual Trend of Put up in Sets or Outfits from China from Jan. to June of 2010-2013
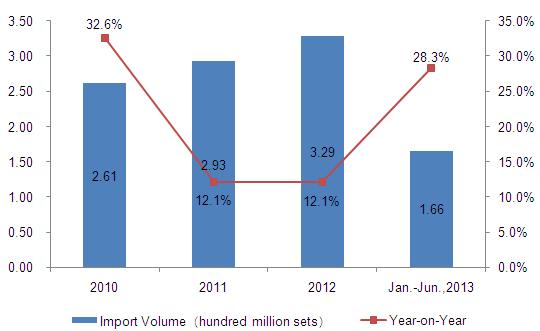
The United States import volume of put up in sets or outfits from China increased year by year from 2010 to 2012. From Jan. to June in 2013, the import volume amounted to 166 million, with an increase of 28.3%
The United States Import Value Annual Trend of Put up in Sets or Outfits from China from Jan. to June of 2010-2013
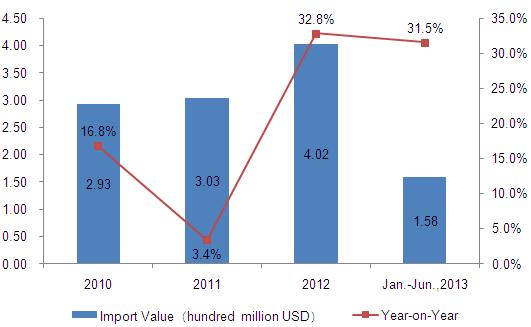
The United States import value of put up in sets or outfits from China increased year by year from 2010 to 2012. From Jan. to June in 2013, the import value amounted to 158 million US dollars, with an increase of 31.5%.
The United States Import Volume Annual Trend of Other Toys and Models Incorporating a Motor from China from Jan. to June of 2010-2013
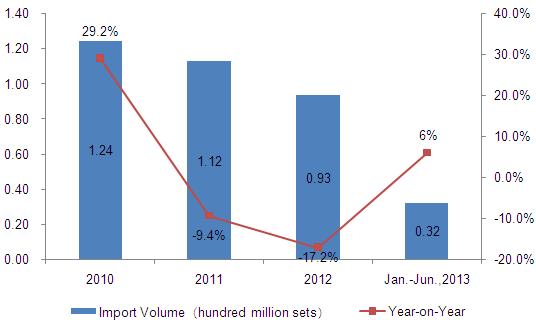
The United States import volume of other toys and models incorporating a motor from China decreased year by year from 2010 to 2012. From Jan. to June in 2013, the import volume amounted to 32 million, with an increase of 6%
The United States Import Value Annual Trend of Other Toys and Models Incorporating a Motor from China from Jan. to June of 2010-2013
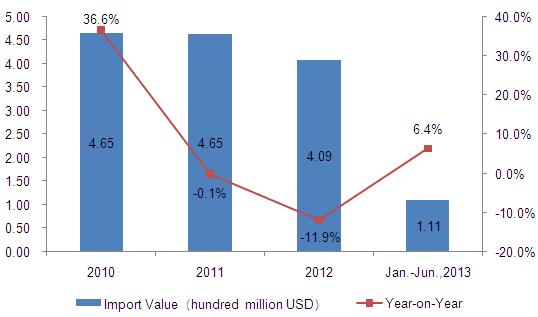
The United States import value of other toys and models incorporating a motor from China had a little change from 2010 to 2012. Import value of 2012 was slightly lower than that of 2011, and that of 2011 is impartial with that of 2010. From Jan. to June in 2013, the import value amounted to 111 million US dollars, with an increase of 6.4%.
The United States Import Volume Annual Trend of Other Toys Not Elsewhere Specified or Included from China from Jan. to June of 2010-2013
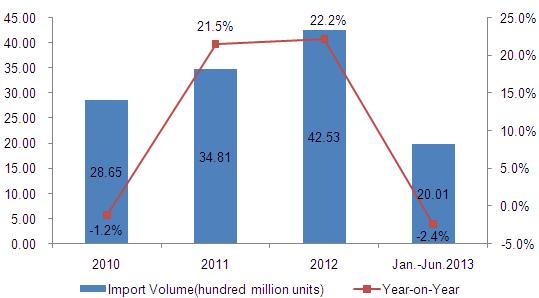
The United States import volume of other toys from China increased year by year from 2010 to 2012. From Jan. to June in 2013, the import volume amounted to 2.001 billion, with a decrease of 2.4%.
The United States Import Value Annual Trend of Other Toys Not Elsewhere Specified or Included from China from Jan. to June of 2010-2013
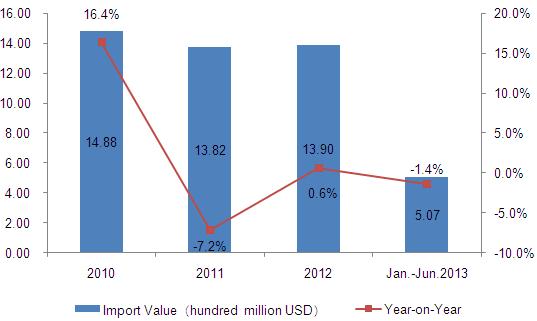
The United States import value of other toys from China showed a trend of "V" from 2010 to 2012. From Jan. to June in 2013, the import value amounted to 507 million US dollars, with a decrease of 1.4%.
The United States Import Volume Annual Trend of Parts and Accessories from China from Jan. to June of 2010-2013
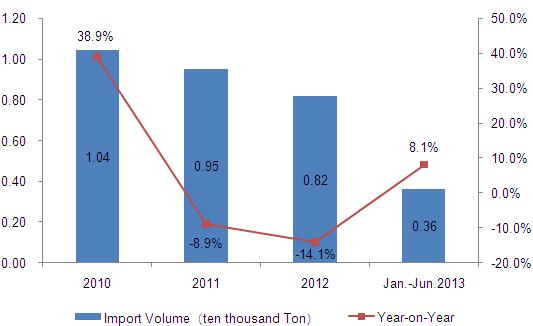
The United States import volume of parts and accessories from China decreased year by year from 2010 to 2012. From Jan. to June in 2013, the import volume amounted to 3600 tons, with an increase of 8.1%.
The United States Import Value Annual Trend of Parts and Accessories from China from Jan. to June of 2010-2013
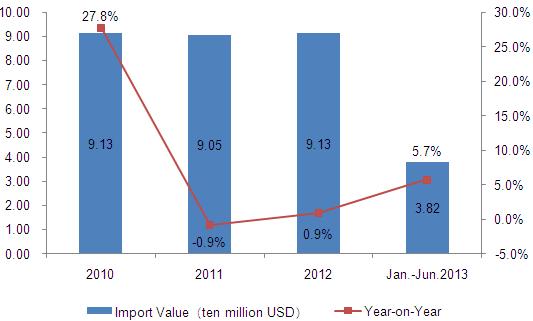
The United States import value of parts and accessories from China showed a trend of "V" from 2010 to 2012. Import value of 2012 was slightly higher than that of 2011, and is impartial with that of 2010. From Jan. to June in 2013, the import value amounted to 38.2 million US dollars, with an increase of 5.7%.
Source: China Customs Network


