Note:
| HS Code | Product Name |
| 8507 | Battery, including separators, rectangular (or including square), hereinafter referred to as "Battery". |
2011-2013 China Battery Export Value Trend
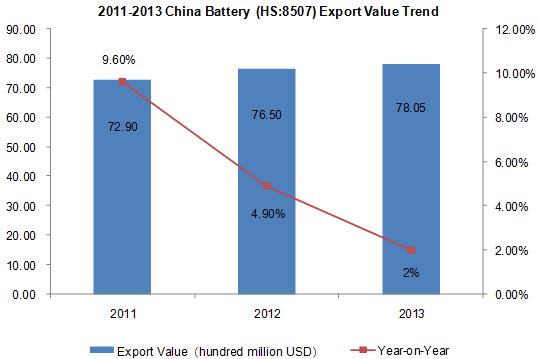
As can be seen from the above chart, China battery export value, increased year-on-year (YOY) from 2011 to 2013. Three-year export value was $ 7.29 billion (an increase of 9.6%), $ 7.65 billion (up 4.9%), $ 7.805 billion (an increase of 2%).
2013 China Battery Monthly Export Volume and Value
| Month | Volume (Kg) | Value (USD) | Than Last Year | |
| Volume | Value | |||
| Jan. | 161,311,000 | 593,378,348 | 3% | 4.7% |
| Feb. | 118,456,277 | 459,937,994 | -17% | -2.1% |
| Mar. | 161,921,528 | 581,726,445 | -23% | -13.4% |
| Apr. | 154,085,726 | 590,921,690 | -11.8% | -2.3% |
| May | 168,558,848 | 629,354,141 | -27.5% | -15.8% |
| Jun. | 159,676,965 | 623,141,783 | -12.3% | -5.5% |
| Jul. | 180,785,664 | 664,835,477 | -0.2% | 0.7% |
| Aug. | 193,055,096 | 685,318,676 | 0.3% | 6.1% |
| Sep. | 191,720,754 | 800,473,521 | -7.9% | 13.5% |
| Oct. | 182,620,695 | 694,552,878 | 2.4% | 18.8% |
| Nov. | 175,643,471 | 735,382,596 | -1.1% | 15.1% |
| Dec. | 189,313,555 | 746,215,972 | -3.5% | 7.4% |
From January to December 2013, China battery export peak period was August, compared with the same period in 2012, export volume increased slightly by 0.3% year on year, export value grew 6.1%.
| No. | Country/ Region | Export Value(USD) | Export Value Growth in 2013 than 2011 | ||
| 2011 | 2012 | 2013 | |||
| 1 | Hong Kong | 2,151,108,286 | 2,184,383,647 | 2,257,769,062 | 4.96% |
| 2 | USA | 866,362,404 | 941,423,149 | 925,768,651 | 6.86% |
| 3 | Japan | 444,447,719 | 473,282,355 | 555,461,454 | 24.98% |
| 4 | India | 436,157,065 | 422,876,724 | 437,280,891 | 0.26% |
| 5 | Republic of Korea | 392,902,866 | 367,038,132 | 325,668,795 | -17.11% |
| 6 | Vietnam | 183,314,644 | 257,418,117 | 323,966,567 | 76.73% |
| 7 | Brazil | 277,988,433 | 291,763,532 | 230,228,949 | -17.18% |
| 8 | Germany | 201,471,385 | 214,275,033 | 211,404,851 | 4.93% |
| 9 | Chinese Taipei | 243,189,096 | 212,337,770 | 187,137,311 | -23.05% |
| 10 | Netherlands | 180,519,109 | 171,495,463 | 141,426,396 | -21.66% |
| 11 | Indonesia | 55,705,174 | 93,252,129 | 138,504,684 | 148.64% |
| 12 | Malaysia | 107,581,151 | 84,289,557 | 126,522,219 | 17.61% |
| 13 | United Kingdom | 109,305,321 | 118,963,843 | 120,855,870 | 10.57% |
| 14 | Singapore | 103,816,780 | 127,771,254 | 118,102,486 | 13.76% |
| 15 | Australia | 85,868,434 | 107,265,727 | 106,576,597 | 24.12% |
| 16 | Italy | 115,732,116 | 114,477,205 | 101,680,092 | -12.14% |
| 17 | Russian Federation | 92,782,792 | 100,735,329 | 87,344,987 | -5.86% |
| 18 | United Arab Emirates | 71,022,955 | 92,916,433 | 82,193,200 | 15.73% |
| 19 | Nigeria | 50,682,684 | 46,059,349 | 80,273,386 | 58.38% |
| 20 | Mexico | 52,481,867 | 54,617,411 | 63,848,983 | 21.66% |
China battery top three export markets were Hong Kong, the USA and Japan.
In 2013, the export value to Hong Kong, the USA and Japan respectively was $ 2.258 billion, $ 926 million, $ 555 million, increased by 4.96%, 6.86% and 24.98% compared with 2011. Among the above listed twenty largest export markets, the export value growth of Indonesia was the biggest, increased 148.64% in 2013 compared with 2011; followed by Vietnam, and in 2013 it increased by 76.73% compared to 2011.
2011-2013 China Battery Export Market Share Analysis
| No. | Country/Region | Value Percentage | ||
| 2011 | 2012 | 2013 | ||
| 1 | Hong Kong | 29.51% | 28.56% | 28.93% |
| 2 | USA | 11.88% | 12.31% | 11.86% |
| 3 | Japan↑ | 6.10% | 6.19% | 7.12% |
| 4 | India | 5.98% | 5.53% | 5.60% |
| 5 | Republic of Korea↓ | 5.39% | 4.80% | 4.17% |
| 6 | Vietnam↑ | 2.51% | 3.37% | 4.15% |
| 7 | Brazil | 3.81% | 3.81% | 2.95% |
| 8 | Germany | 2.76% | 2.80% | 2.71% |
| 9 | Chinese Taipei | 3.34% | 2.78% | 2.40% |
| 10 | Netherlands↓ | 2.48% | 2.24% | 1.81% |
| 11 | Indonesia↑ | 0.76% | 1.22% | 1.77% |
| 12 | Malaysia | 1.48% | 1.10% | 1.62% |
| 13 | United Kingdom | 1.50% | 1.56% | 1.55% |
| 14 | Singapore | 1.42% | 1.67% | 1.51% |
| 15 | Australia | 1.18% | 1.40% | 1.37% |
| 16 | Italy↓ | 1.59% | 1.50% | 1.30% |
| 17 | Russian Federation | 1.27% | 1.32% | 1.12% |
| 18 | United Arab Emirates | 0.97% | 1.21% | 1.05% |
| 19 | Nigeria | 0.70% | 0.60% | 1.03% |
| 20 | Mexico | 0.72% | 0.71% | 0.82% |
Note: “↑”represents that the indicators listed, continued to increase from 2011 to 2013, “↓”represents that the indicators listed, continued to decrease from 2011 to 2013.
2013 data shows, as the three former China battery export markets, Hong Kong, the USA and Japan respectively accounted for 28.93%, 11.86% and 7.12% of that year total China export value.
From three years of market proportion, the import value proportion of Japan, Vietnam and Indonesia continued to rise, the country which continued to decline includes Republic of Korea、Netherlands and Italy.
2013 China Battery Original Places of Exported Goods
| No. | Region | Volume (Kg) | Value (USD) | Compared to the Same Period Last Year | |
| Volume | Value | ||||
| 1 | Guangdong | 1,081,778,678 | 3,510,741,976 | -5.2% | 11.9% |
| 2 | Jiangsu | 304,086,214 | 1,483,517,260 | -21.4% | -19.4% |
| 3 | Tianjin | 210,203,566 | 494,457,319 | -18.8% | -23.1% |
| 4 | Shanghai | 83,096,197 | 431,139,188 | -21% | -1.2% |
| 5 | Zhejiang | 46,454,652 | 373,735,910 | 0.8% | 17.5% |
| 6 | Beijing | 52,120,131 | 300,162,861 | -0.4% | 51.2% |
| 7 | Shandong | 45,450,275 | 189,093,637 | 31% | 15.6% |
| 8 | Fujian | 33,694,723 | 184,595,326 | -1.2% | -4.4% |
| 9 | Hubei | 14,868,958 | 183,939,420 | -28.9% | -14.5% |
| 10 | Hunan | 25,170,802 | 117,979,627 | 13% | 8.9% |
Guangdong and Jiangsu were the main sources of China battery. In 2013, the export volume of the above two provinces account for 68.03% of the total, total export value accounted for 63.99%.


