| HS Code | Product Name |
| 940510 | Chandeliers & Other Electric Ceiling or Wall Lighting Fittings |
| 940520 | Electric Table, Desk, Bedside or Floor-standing Lamps |
| 940530 | Lighting Sets of a Kind Used for Christmas Trees |
| 940540 | Other Electric Lamps and Lighting Fittings |
| 940550 | Non-electrical Lamps and Lighting Fittings |
| 940560 | Illuminated Signs, Illuminated Name Plates and the Like |
The Importation of Chandeliers & Other Electric Ceiling or Wall Lighting Fittings (HS:940510)between 2010-2012 in Australia
The Import Value Annual Trend of Chandeliers & Other Electric Ceiling or Wall Lighting Fittings between 2010-2012 in Australia
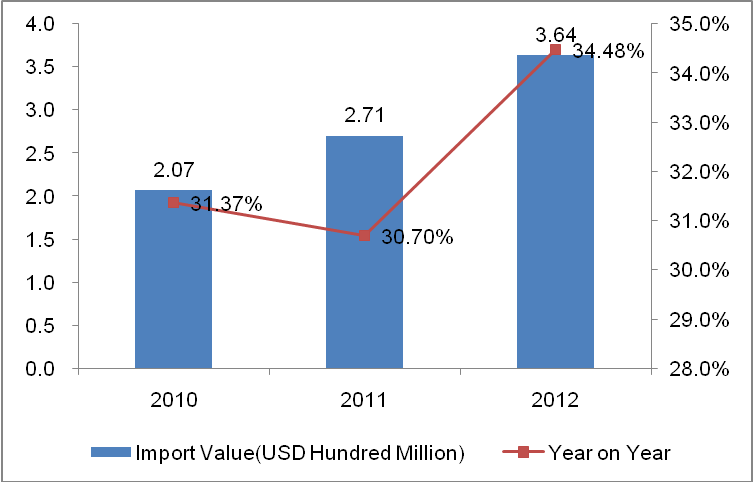
The import value of Chandeliers & Other Electric Ceiling or Wall Lighting Fittings keeps increasing during 2010-2012 at Australia, reached $ 207 million (increased 31.37%) at 2010, $ 271 million (increased 30.7%) at 2011 and $ 364 million (increased 34.48%) at 2012.
The Mainly Original Goods Delivered Countries for Australian Chandeliers & Other Electric Ceiling or Wall Lighting Fittings during 2010 - 2012.
(unit:USD thousand)
| Country/Region | 2010 | 2011 | 2012 |
| China | 104,444 | 149,697 | 236,830 |
| Germany | 13,236 | 15,586 | 16,088 |
| Italy | 8,252 | 11,686 | 12,198 |
| Malaysia | 9,242 | 8,794 | 9,793 |
| HK | 3,554 | 5,937 | 7,404 |
| Taiwan | 2,829 | 2,780 | 6,282 |
| USA | 2,380 | 3,606 | 5,940 |
| UK | 4,166 | 3,440 | 5,178 |
| Belgium | 2,792 | 4,720 | 4,496 |
| New Zealand | 3,493 | 5,124 | 3,890 |
The Marketing Share Trends for Mainly Export Countries/Regions of Australian Chandeliers & Other Electric Ceiling or Wall Lighting Fittings during 2010 - 2012
| Country/Region | 2010 | 2011 | 2012 |
| China↑ | 50.45% | 55.32% | 65.08% |
| Germany↓ | 6.39% | 5.76% | 4.42% |
| Italy | 3.99% | 4.32% | 3.35% |
| Malaysia↓ | 4.46% | 3.25% | 2.69% |
| HK | 1.72% | 2.19% | 2.03% |
| Taiwan | 1.37% | 1.03% | 1.73% |
| USA↑ | 1.15% | 1.33% | 1.63% |
| UK | 2.01% | 1.27% | 1.42% |
| Belgium | 1.35% | 1.74% | 1.24% |
| New Zealand | 1.69% | 1.89% | 1.07% |
Note:↑means the index keeps increasing between 2010-2012,↓means the index keeps dropping between 2010-2012
According to export marketing share trend, China and USA keep increasing between 2010-2012, but Germany and Malaysia keeps dropping down year by year.
The Importation of Electric Table, Desk, Bedside or Floor-Standing Lamps (HS:940520)between 2010-2012 in Australia
The Import Value Annual Trend of Electric Table, Desk, Bedside or Floor-Standing Lamps between 2010-2012 in Australia
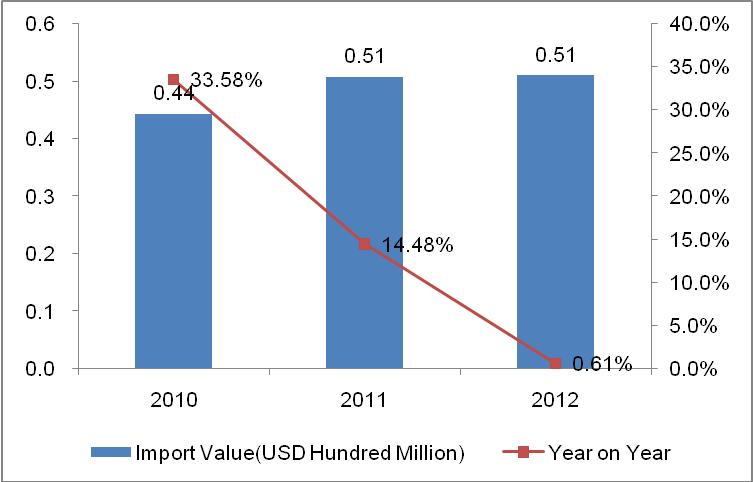
The import value of Electric Table, Desk, Bedside or Floor-standing Lamps keeps higher during 2010-2012 at Australia, reached $ 44 million (increased 33.58%) at 2012, $ 51 million (increased 14.48%) at 2011 and $ 51 million (increased 0.61%) at 2010.
The Mainly Original Goods Delivered Countries for Australian Electric Table, Desk, Bedside or Floor-Standing Lamps during 2010 - 2012.
(Unit: USD thousand)
| Country/Region | 2010 | 2011 | 2012 |
| China | 35,368 | 41,163 | 41,902 |
| Italy | 2,023 | 1,886 | 2,086 |
| India | 746 | 1,263 | 1,290 |
| Philippines | 347 | 523 | 723 |
| HK | 1,160 | 779 | 639 |
| USA | 505 | 678 | 570 |
| France | 483 | 953 | 451 |
| Taiwan | 749 | 281 | 420 |
| UK | 294 | 419 | 343 |
| Denmark | 152 | 146 | 317 |
The Marketing Share Trends for Mainly Export Countries/Regions of Australian Electric Table, Desk, Bedside or Floor-Standing Lamps during 2010 - 2012.
| Country/Region | 2010 | 2011 | 2012 |
| China↑ | 79.70% | 81.02% | 81.98% |
| Italy | 4.56% | 3.71% | 4.08% |
| India↑ | 1.68% | 2.49% | 2.52% |
| Philippines↑ | 0.78% | 1.03% | 1.41% |
| HK↓ | 2.61% | 1.53% | 1.25% |
| USA | 1.14% | 1.33% | 1.12% |
| France | 1.09% | 1.88% | 0.88% |
| Taiwan | 1.69% | 0.55% | 0.82% |
| UK | 0.66% | 0.82% | 0.67% |
| Denmark | 0.34% | 0.29% | 0.62% |
Note:↑means the index keeps increasing between 2010-2012,↓means the index keeps dropping between 2010-2012
According to export marketing share trend, China & Philippines and India keep increasing between 2010-2012, but HK keeps dropping down year by year.
The Importation of Lighting Sets of a Kind Used for Christmas Trees (HS: 940530) between 2010-2012 in Australia
The Import Value Annual Trend of Lighting Sets of a Kind Used for Christmas Trees between 2010-2012 in Australia
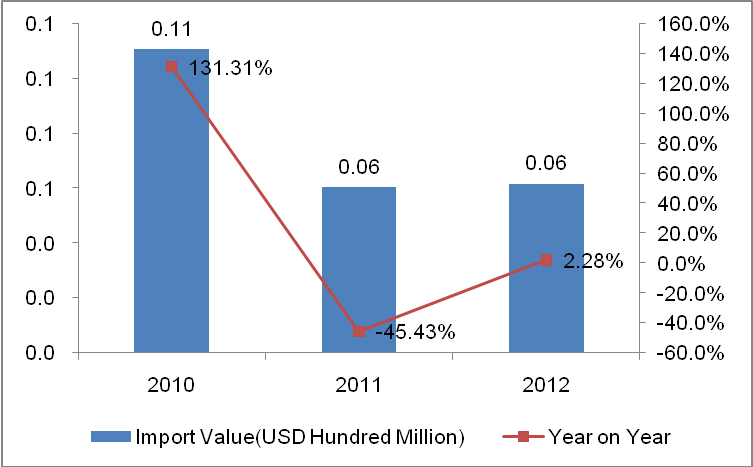
During 2010-2012, the import value trend of Australian Lighting Sets of a Kind Used for Christmas Trees like a "V", and reached $ 11 million (increased 131.31%) at 2012, $ 6 million (increased 45.43%) at 2011 and $ 6 million (increased 2.28%) at 2010.
The Mainly Original Goods Delivered Countries for Australian Lighting Sets of a Kind Used for Christmas Trees during 2010 - 2012.
(Unit:USD thousand)
| Country/Region | 2010 | 2011 | 2012 |
| China | 11,054 | 5,603 | 6,128 |
| HK | 5 | 50 | 42 |
| Thailand | 5 | 1 | 11 |
| UK | 0 | 0 | 1 |
| Korea | 0 | 0 | 0 |
| Belgium | 0 | 205 | 0 |
| Germany | 0 | 109 | 0 |
| Indonesia | 0 | 0 | 0 |
| Italy | 5 | 0 | 0 |
| Japan | 0 | 15 | 0 |
The Import Value Annual Trend of Lighting Sets of a Kind Used for Christmas Trees between 2010-2012 in Australia
| Country/Region | 2010 | 2011 | 2012 |
| China | 99.81% | 92.70% | 99.13% |
The Importation of Other Electric Lamps and Lighting Fittings(HS:940540)between 2010-2012 in Australia
The Import Value Annual Trend of Other Electric Lamps and Lighting Fittings between 2010-2012 in Australia
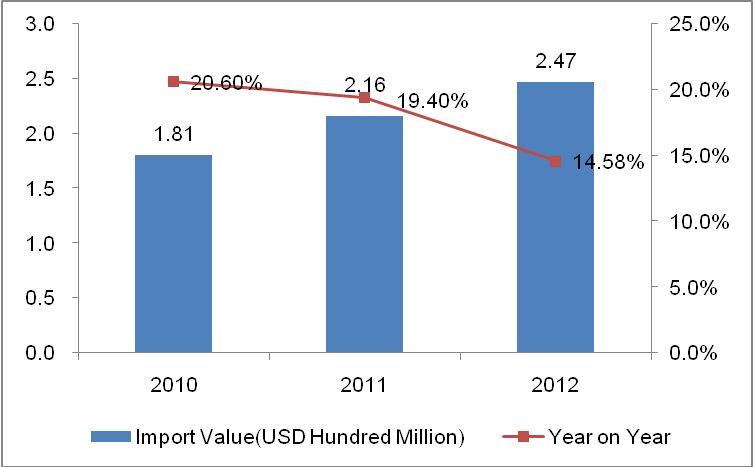
The import value of Other Electric Lamps and Lighting Fittings keeps increasing during 2010-2012 at Australia, reached $ 181 million (increased 20.6%) at 2010, $ 216 million (increased 19.4%) at 2011 and $ 247 million (increased 14.58%) at 2012.
The Mainly Original Goods Delivered Countries for Australian Other Electric Lamps and Lighting Fittings during 2010 - 2012.
(Unit: USD thousand)
| Country/Region | 2010 | 2011 | 2012 |
| China | 98,628 | 119,595 | 144,787 |
| USA | 14,110 | 20,556 | 22,894 |
| UK | 5,940 | 10,224 | 14,477 |
| Germany | 10,457 | 11,867 | 12,884 |
| Italy | 7,778 | 9,987 | 9,400 |
| New Zealand | 6,414 | 6,185 | 5,075 |
| France | 5,099 | 4,100 | 4,215 |
| Taiwan | 3,905 | 3,850 | 3,943 |
| Thailand | 3,445 | 3,357 | 3,130 |
| Spain | 1,582 | 1,031 | 2,830 |
The Import Value Annual Trend of Other Electric Lamps and Lighting Fittings between 2010-2012 in Australia.
| Country/Region | 2010 | 2011 | 2012 |
| China↑ | 54.56% | 55.41% | 58.54% |
| USA | 7.81% | 9.52% | 9.26% |
| UK↑ | 3.29% | 4.74% | 5.85% |
| Germany↓ | 5.78% | 5.50% | 5.21% |
| Italy | 4.30% | 4.63% | 3.80% |
| New Zealand↓ | 3.55% | 2.87% | 2.05% |
| France↓ | 2.82% | 1.90% | 1.70% |
| Taiwan↓ | 2.16% | 1.78% | 1.59% |
| Thailand↓ | 1.91% | 1.56% | 1.27% |
| Spain | 0.88% | 0.48% | 1.14% |
Note:↑means the index keeps increasing between 2010-2012,↓means the index keeps dropping between 2010-2012
According to export marketing share trend, China and UK keep increasing between 2010 and 2012, but the countries/regions keep dropping down year by year, which include Germany, New Zealand, France, Taiwan and Thailand.
The Importation of Non-Electrical Lamps and Lighting Fittings(HS:940550) between 2010-2012 in Australia
The Import Value Annual Trend of Non-Electrical Lamps and Lighting Fittings between 2010-2012 in Australia
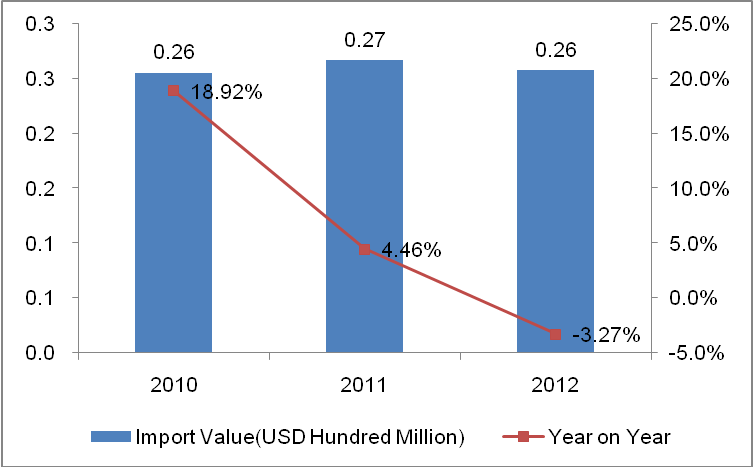
During 2010-2012, the import value trend of Australian Non-electrical Lamps and Lighting Fittings like a opposite "V", reached $ 26 million (increased 18.92%) at 2010, $ 27 million (increased 4.46%) at 2011 and $ 26 million (dropped 3.27%) at 2012.
The Mainly Original Goods Delivered Countries for Australian Non-Electrical Lamps and Lighting Fittings during 2010 - 2012.
(Unit: USD thousand)
| Country/Region | 2010 | 2011 | 2012 |
| China | 19,235 | 20,808 | 20,126 |
| India | 2,275 | 1,917 | 2,469 |
| Vietnam | 485 | 432 | 509 |
| USA | 477 | 381 | 314 |
| Philippines | 270 | 393 | 291 |
| Denmark | 65 | 135 | 245 |
| Indonesia | 306 | 248 | 240 |
| UK | 97 | 136 | 188 |
| Taiwan | 254 | 214 | 155 |
| Italy | 150 | 125 | 126 |
The Import Value Annual Trend of Non-Electrical Lamps and Lighting Fittings between 2010-2012 in Australia
| Country/Region | 2010 | 2011 | 2012 |
| China | 75.31% | 77.99% | 77.99% |
| India | 8.91% | 7.19% | 9.57% |
| Vietnam | 1.90% | 1.62% | 1.97% |
| USA↓ | 1.87% | 1.43% | 1.22% |
| Philippines | 1.06% | 1.47% | 1.13% |
| Denmark↑ | 0.25% | 0.51% | 0.95% |
| Indonesia | 1.20% | 0.93% | 0.93% |
| UK↑ | 0.38% | 0.51% | 0.73% |
| Taiwan↓ | 0.99% | 0.80% | 0.60% |
| Italy | 0.59% | 0.47% | 0.49% |
Note:↑means the index keeps increasing between 2010-2012,↓means the index keeps dropping between 2010-2012
According to export marketing share trend, Denmark and UK keep increasing between 2010-2012, but USA and Taiwan keep dropping down year by year.
The Importation of Illuminated Signs, Illuminated Name Plates and the Like (HS:940560)between 2010-2012 in Australia
The Import Value Annual Trend of Illuminated Signs, Illuminated Name Plates and the Like between 2010-2012 in Australia
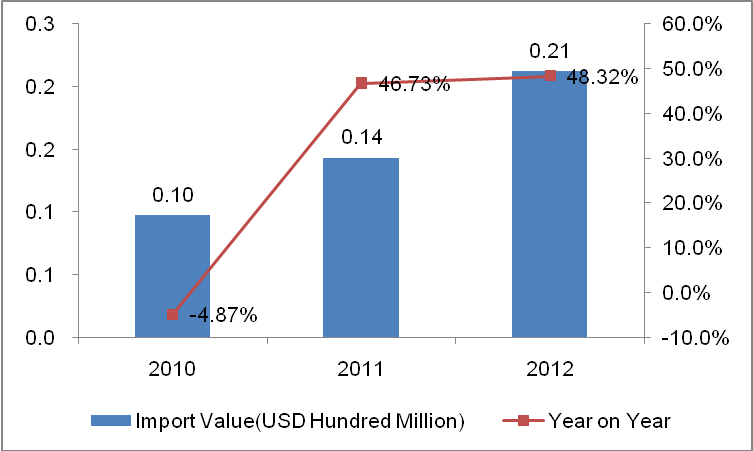
The import value of Illuminated Signs, Illuminated Name Plates and the Like keeps increasing during 2010-2012 at Australia, reached $ 10 million (dropped 4.87%) at 2010, $ 14 million (increased 46.73%) at 2011 and $ 21 million (increased 48.32%) at 2012.
The Mainly Original Goods Delivered Countries for Australian Illuminated Signs, Illuminated Name Plates and the Like during 2010 - 2012.
(Unit:USD thousand)
| Country/Region | 2010 | 2011 | 2012 |
| China | 4,821 | 4,251 | 14,635 |
| Malaysia | 1,096 | 5,665 | 1,503 |
| USA | 436 | 708 | 1,146 |
| Thailand | 807 | 579 | 698 |
| HK | 107 | 315 | 639 |
| New Zealand | 819 | 494 | 479 |
| Germany | 470 | 363 | 449 |
| Korea | 266 | 503 | 315 |
| Sweden | 247 | 83 | 283 |
| France | 70 | 538 | 169 |
The Import Value Annual Trend of Illuminated Signs, Illuminated Name Plates and the Like between 2010-2012 in Australia
| Country/Region | 2010 | 2011 | 2012 |
| China | 49.38% | 29.67% | 68.87% |
| Malaysia | 11.22% | 39.54% | 7.07% |
| USA↑ | 4.47% | 4.94% | 5.39% |
| Thailand↓ | 8.27% | 4.04% | 3.28% |
| HK↑ | 1.10% | 2.20% | 3.01% |
| New Zealand↓ | 8.39% | 3.45% | 2.25% |
| Germany↓ | 4.81% | 2.53% | 2.11% |
| Korea | 2.72% | 3.51% | 1.48% |
| Sweden | 2.53% | 0.58% | 1.33% |
| France | 0.72% | 3.76% | 0.80% |
Note:↑means the index keeps increasing between 2010-2012,↓means the index keeps dropping between 2010-2012
According to export marketing share trend, USA and HK keep increasing between 2010-2012, but Thailand, New Zealand and Germany keep dropping down year by year.


