Export Quantity & Value for Chinese Electric Coffee Machine or Teapot from Jan. to Dec. 2013
| Month | Quantity (Piece) | Value (USD) | Year on Year | |
| Quantity | Value | |||
| Jan. | 12,087,620 | 196,637,195 | 4.7% | 23.5% |
| Feb. | 7,346,445 | 121,290,494 | 17% | 18.6% |
| March | 8,704,232 | 157,680,596 | -18% | -3.9% |
| April | 11,324,212 | 184,218,882 | 0.4% | 8.8% |
| May | 11,163,834 | 179,652,335 | -1.5% | 6.3% |
| June | 11,056,150 | 186,881,584 | -0.7% | 17.8% |
| July | 13,730,095 | 247,207,812 | 20.8% | 42% |
| August | 14,312,278 | 277,999,629 | 12% | 28.8% |
| Sep. | 13,816,762 | 264,412,340 | -3.5% | 2.4% |
| Oct. | 12,638,104 | 268,807,984 | -6.5% | 10.9% |
| Nov. | 10,453,129 | 204,921,204 | 1.6% | 9.8% |
| Dec. | 9,495,764 | 194,937,789 | -30.8% | -19.5% |
| Total from Jan. to Dec. | 136,128,625 | 2,484,647,844 | -1.5% | 10.8% |
The total export quantity for Chinese electric coffee machine or teapot from Jan. to Dec. 2013 achieved 136 million pieces, and declined 1.5% year on year. The total export value reached 2485 million USD, and increased 10.8% year on year.
Major Countries/Regions for Chinese Electric Coffee Machine or Teapot Export from Jan. to Dec. 2013
| No. | Countries/Regions | Quantity (Piece) | Value (USD) | Year on Year | |
| Quantity | Value | ||||
| 1 | USA | 36,953,659 | 832,202,442 | -2.2% | 5.7% |
| 2 | Germany | 12,513,550 | 353,305,972 | 19.8% | 47.4% |
| 3 | United Kingdom | 8,152,279 | 122,502,368 | 4.7% | 13.1% |
| 4 | Canada | 4,109,696 | 101,564,384 | -27.7% | -21.5% |
| 5 | France | 5,306,278 | 97,162,015 | -9.4% | -4.2% |
| 6 | Italy | 2,163,771 | 86,377,587 | 10.9% | 20.7% |
| 7 | Brazil | 5,931,054 | 81,910,792 | 34.2% | 82.7% |
| 8 | Hong Kong | 2,558,502 | 78,404,692 | -14.8% | 47% |
| 9 | Australia | 2,598,547 | 68,418,169 | -30.7% | -27.4% |
| 10 | Netherlands | 4,664,927 | 62,755,015 | 3% | 7.9% |
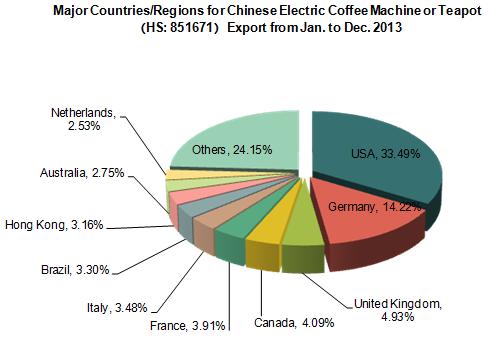
USA ranked first for Chinese electric coffee machine or teapot export. The total export value to USA for Chinese electric coffee machine or teapot from Jan. to Dec. 2013 was about 832million USD, increased 5.7% year on year, and occupied 33.49% of all. Followed by Germany, and occupied 14.22%.
Major Cities/Provinces for Chinese Electric Coffee Machine or Teapot Export from Jan. to Dec. 2013
| No. | Cities/Provinces | Quantity (Piece) | Value (USD) | Year on Year | |
| Quantity | Value | ||||
| 1 | Guangdong | 88,725,880 | 1,924,583,953 | -6.2% | 7.9% |
| 2 | Zhejiang | 38,550,533 | 305,827,724 | 2.9% | 7.7% |
| 3 | Jiangsu | 5,826,588 | 177,627,800 | 45.9% | 62.9% |
| 4 | Shanghai | 1,218,544 | 32,552,769 | 76% | 42.5% |
| 5 | Fujian | 763,491 | 27,106,224 | -23.4% | -26.5% |
| 6 | Jiangxi | 650,832 | 13,019,039 | 240% | 451.7% |
| 7 | Xinjiang | 132,055 | 1,793,176 | 179.2% | 214% |
| 8 | Anhui | 233,688 | 1,399,272 | 78.4% | 43.2% |
| 9 | Gansu | 17,000 | 331,500 | 0 | 0 |
| 10 | Beijing | 146 | 297,498 | -95.2% | 45.6% |
The major city/province for Chinese electric coffee machine or teapot export was Guangdong, which occupied 65.18% and 77.46% of the total export quantity & value from Jan. to Dec. 2013 respectively.


